
What Is a Trend?
How to Read Trends and Draw Trendlines
Learn to spot uptrends, downtrends and sideways markets with two easy rules, higher highs and higher lows or lower highs and lower lows, then use a trendline to find BUY and SELL entries in the direction of the trend, with real gold chart examples.
What is a trend?
A trend is the direction price is moving at the time. If you can identify a clear trend and trade in its direction, your chances of making a profit improve a lot. In other words, in an uptrend you should look for BUY entries, and in a downtrend you should look for SELL entries.
There are 3 types of trend:
What is an uptrend?
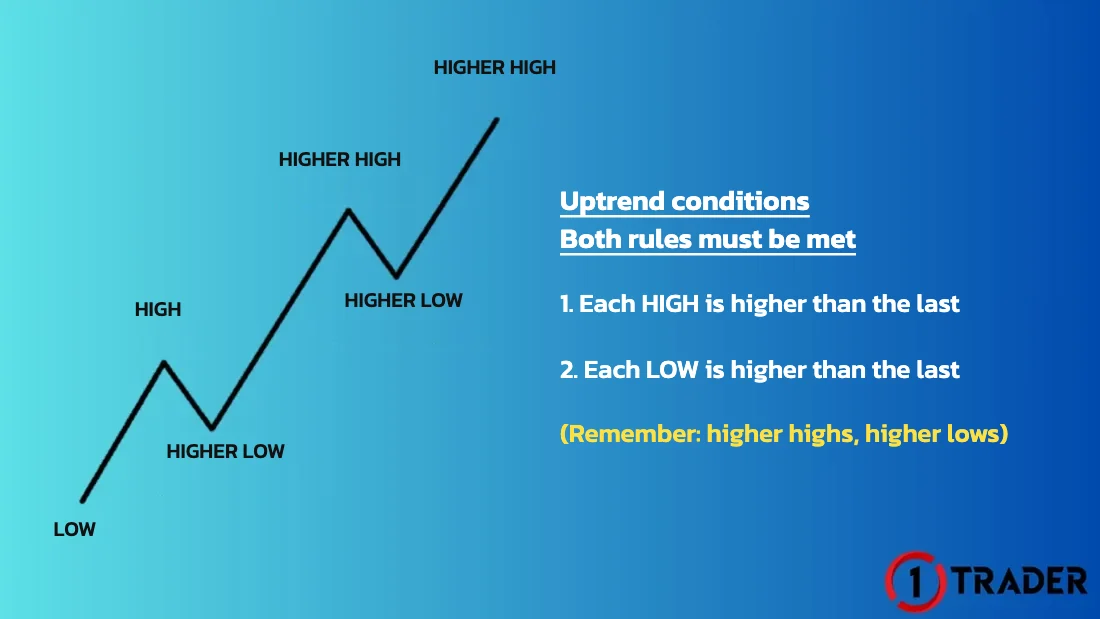
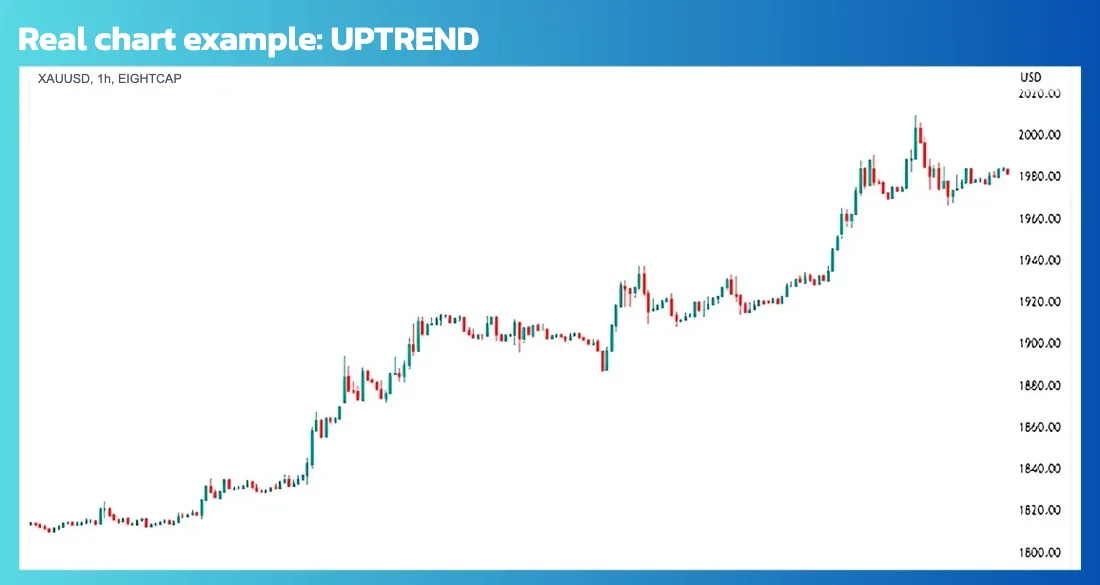
An uptrend is when price keeps moving higher and repeatedly makes new highs above the previous ones.
Uptrend conditions: both rules must be met
What is a downtrend?
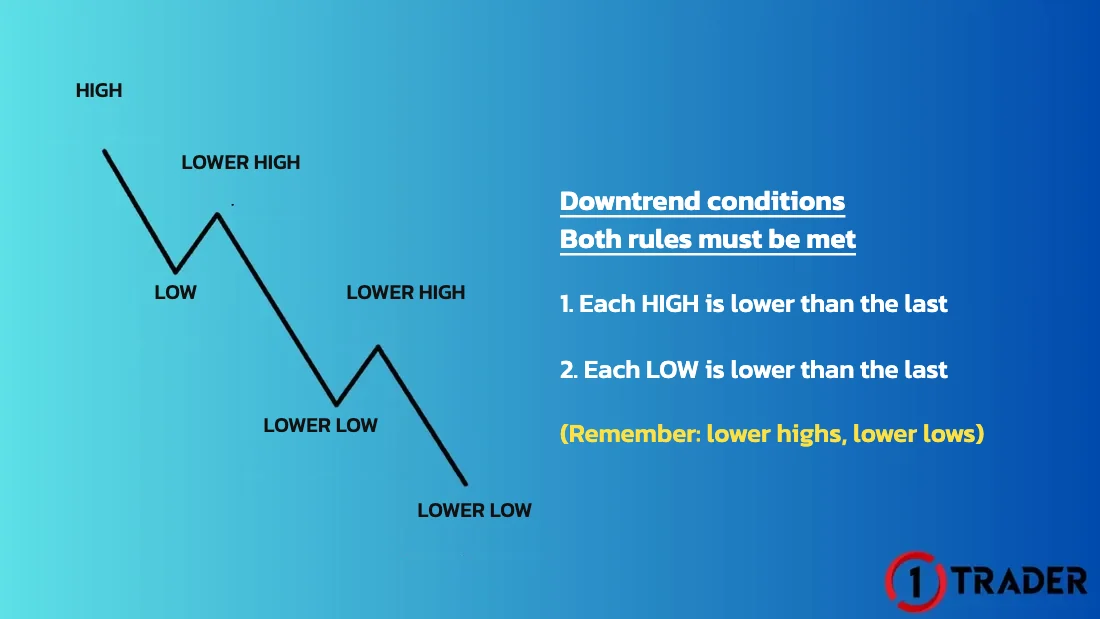
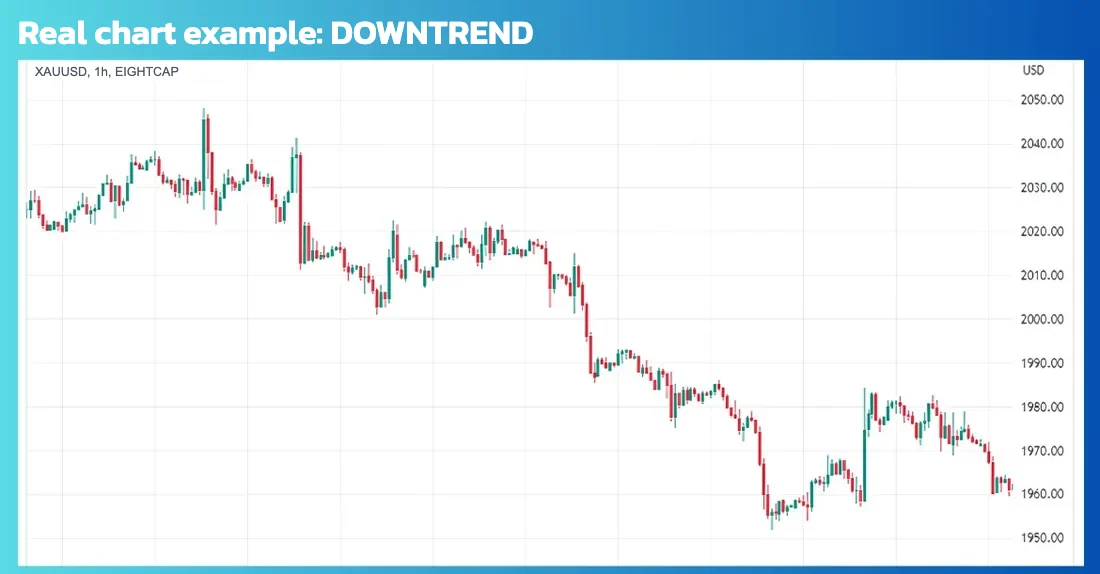
A downtrend is when price keeps moving lower and repeatedly makes new lows below the previous ones.
Downtrend conditions: both rules must be met
What is a sideways market?
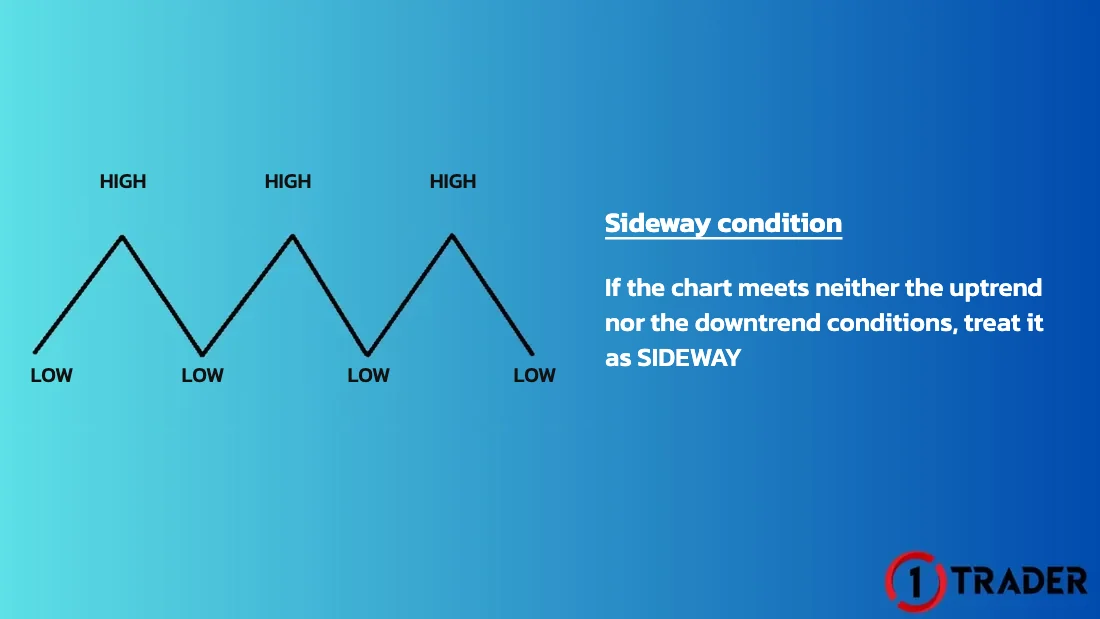
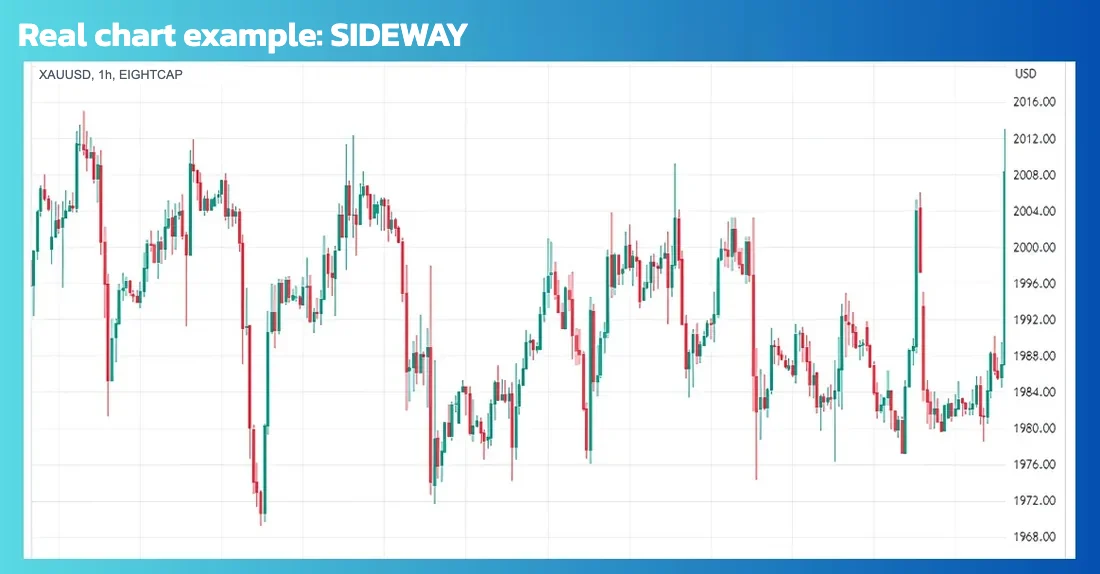
A sideways market (Sideway) is when price moves sideways, going up and down inside a range. An easy way to spot it is that you can draw a rectangle or a triangle around that area.
Sideway condition: if the chart meets neither the uptrend nor the downtrend conditions, treat it as Sideway.
How to draw trendlines in uptrends and downtrends
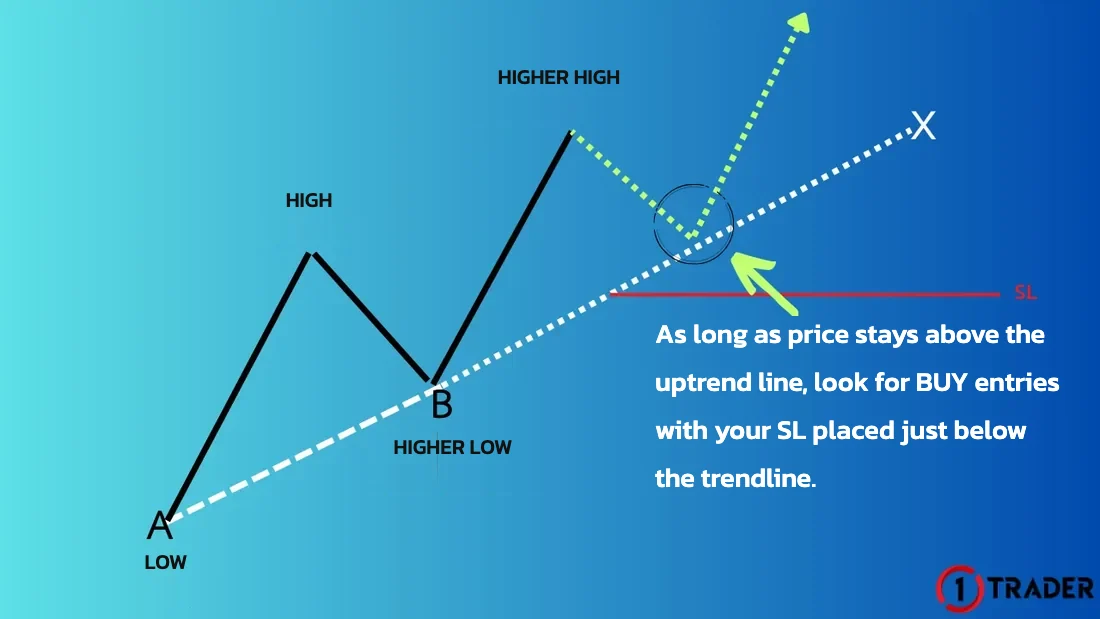
Once you know which trend the chart is in, use a basic tool called the trendline to find entries in the direction of the trend. Draw it from the start of the trend (point A) to the point that confirms the trend (point B), and you get trendline X extending to the right (the white dotted line in the images).
Trendline in an uptrend
Trendline in a downtrend
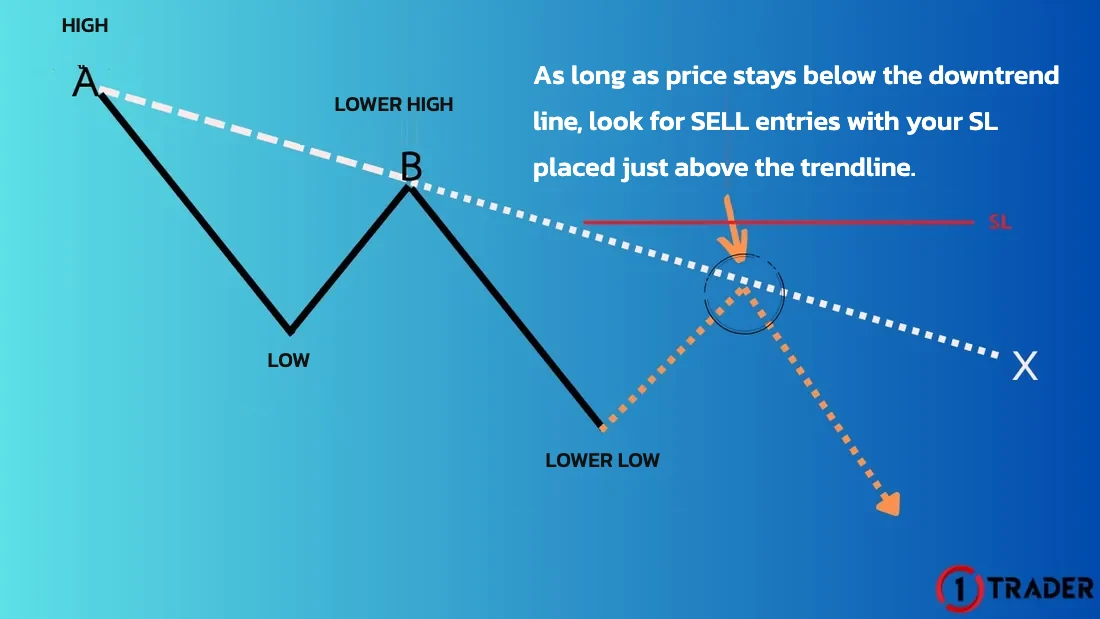
You can enter with the trend anywhere as long as price is still on the same side of the trendline, but the best spot is near or touching the trendline (the circle in the images), because it is closest to your SL, which means the lowest risk.
Trendline examples on a real gold chart
Here is how trendlines work on the 4-hour gold chart (XAUUSD), in both an uptrend and a downtrend.
Uptrend line on a real chart
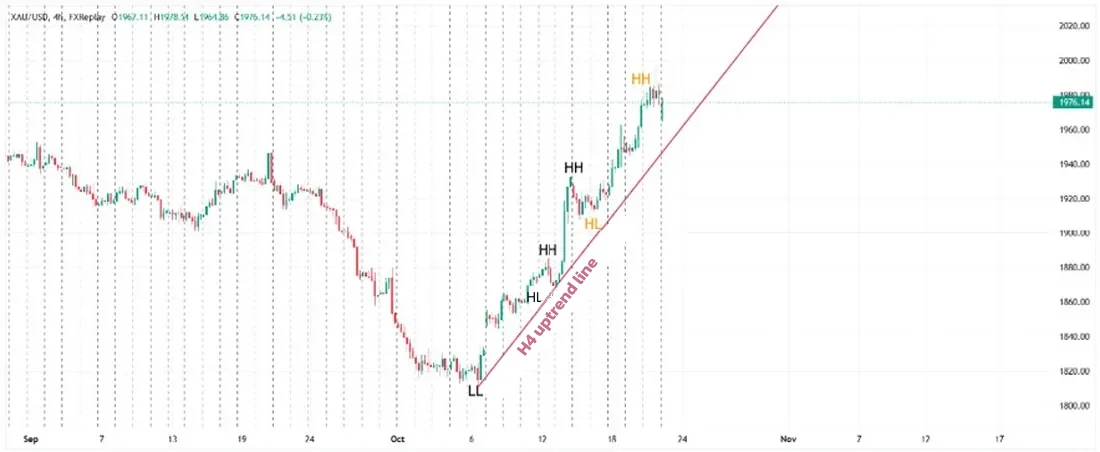
The chart was in an uptrend because it met both rules: higher highs and higher lows. So we can draw an uptrend line from the first low at the start of the trend to the higher low (the red line in the image). As long as price stays above this line, you can look for BUY entries with the trend, with your SL just below the trendline and your take profit (TP) at the new high.
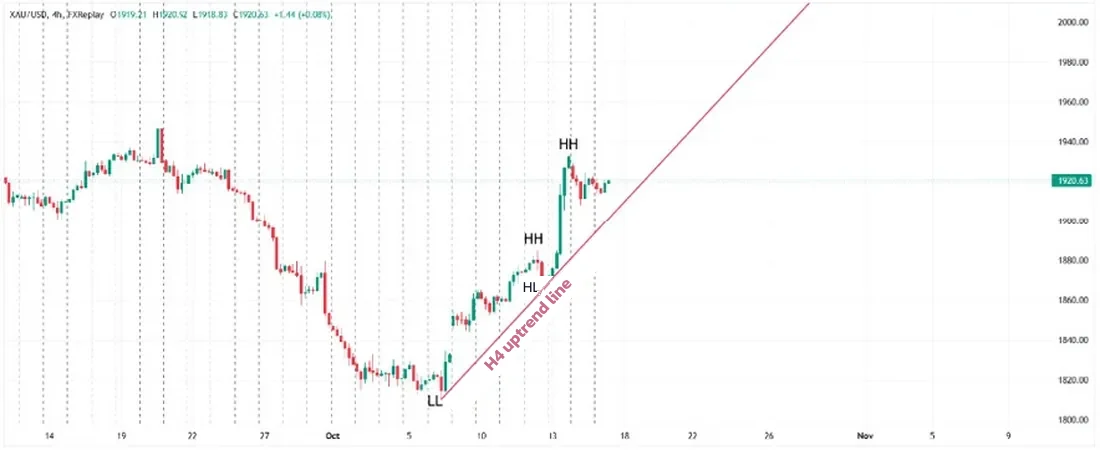
Price then moved up with the trend and went on to make a new high.
Downtrend line on a real chart
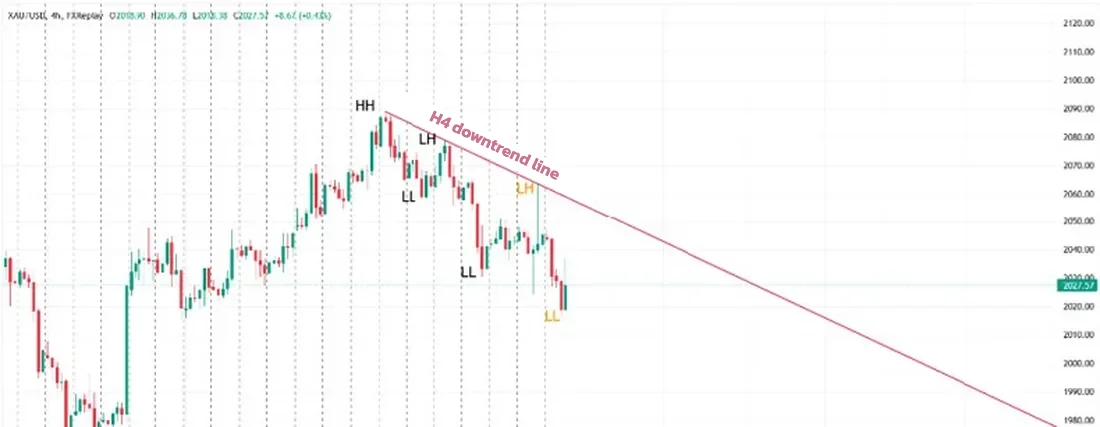
The chart was in a downtrend because it met both rules: lower highs and lower lows. So we can draw a downtrend line from the first high at the start of the trend to the lower high (the red line in the image). As long as price stays below this line, you can look for SELL entries with the trend, with your SL just above the trendline and your take profit (TP) at the new low.
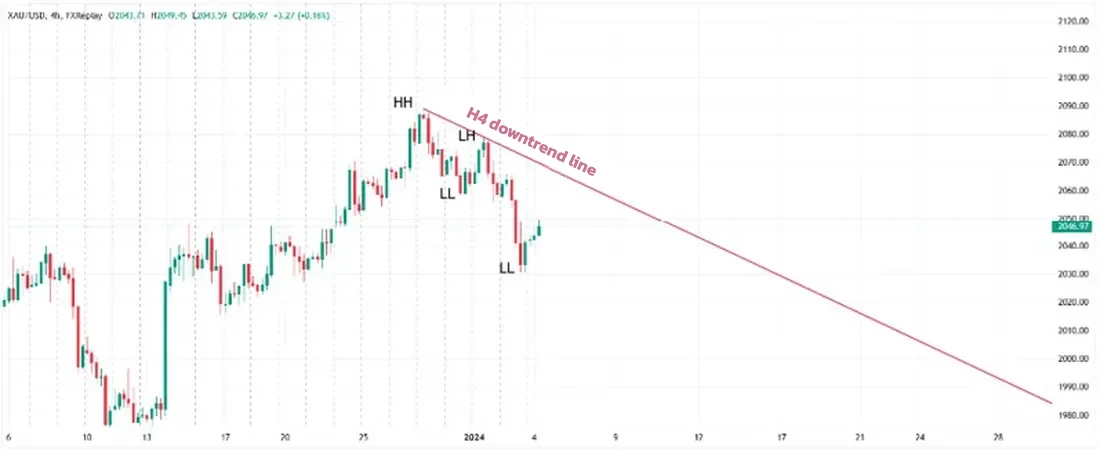
Price then moved down with the trend and went on to make a new low.
This lesson does not cover drawing trendlines in a sideways market, because trading a range has many details of its own.
Summary: reading trends and drawing trendlines
| Trend | Condition | Trendline | Trade | Stop Loss / TP |
|---|---|---|---|---|
| Up Uptrend | Higher highs, higher lows | From the first low → the higher low (the line is support) | BUY (best near the line) | SL just below the line · TP at the new high |
| Down Downtrend | Lower highs, lower lows | From the first high → the lower high (the line is resistance) | SELL (best near the line) | SL just above the line · TP at the new low |
| Sideway Sideway | Neither uptrend nor downtrend | Draw a rectangle / triangle | See EP2 | How to trade a sideway → |
The key to reading a trend is to always check that both rules are met first. Then use a trendline to mark out the trend, trade in the direction of the trend, and always place your stop loss on the other side of the line.
FAQ about trends and trendlines
What is a trend?
A trend is the direction price is moving at the time. There are 3 types: uptrend, downtrend and sideways (Sideway).
How do you spot an uptrend?
Price must make a high that is higher than the previous high and a low that is higher than the previous low. Both rules must be met. Remember: higher highs, higher lows.
How do you spot a downtrend?
Price must make a high that is lower than the previous high and a low that is lower than the previous low. Both rules must be met. Remember: lower highs, lower lows.
How do you spot a sideways market?
If the chart meets neither the uptrend nor the downtrend conditions, treat it as sideways. You will usually be able to draw a rectangle or a triangle around that area.
How do you draw a trendline?
In an uptrend, draw from the lowest point of the trend to the higher low. In a downtrend, draw from the highest point of the trend to the lower high. Then extend the line to the right.
Where should you enter and place your stop loss with a trendline?
You can enter anywhere price is still on the same side of the trendline, but the best spot is near or touching the line because it is closest to your SL. In an uptrend, BUY with your SL just below the line. In a downtrend, SELL with your SL just above the line.
How many points does a trendline need?
At least 2: the start of the trend (point A) and the point that confirms it (point B). If price comes back to touch the line a third time and then continues with the trend, that confirms the line is working well.
What should you do if price breaks the trendline?
If price breaks through to the other side of the trendline, the trend is losing strength and an order with its SL on the other side of the line will be closed. Do not hold against the new move. Wait for the new structure of highs and lows to show whether price is reversing or moving into a sideways range. Read more in EP3: how to spot a trend reversal.
View the course Next lesson · EP2 What Is a Sideway Market? How to Draw the Range and Trade Breakouts Draw trendlines in a sideway, then trade inside the range or trade the breakout
Read EP2 →
See all lessons in the free Forex and gold trading course
Risk warning: Trading Forex, gold and CFDs carries a high level of risk and you may lose money. 1TRADER provides information and education to support your own decisions only. The real chart examples use historical data and do not guarantee future results. Read the full risk disclosure.