

Exness
Top rebate95%$12.83/lot gold
Paid daily, automatically
Free trading course · Updated 17 Oct 2026
A 39-lesson course in 6 stages, from understanding the market and reading charts to indicators, risk control and trade planning, with real gold chart examples. Free to read, no sign-up. English versions are being added lesson by lesson.
Learning path
Within each stage, easier lessons come first. Read in order or jump to the stage you need. Lessons you have read get a check mark.
Stage 1 of 6
Understand the Forex and gold markets, how much capital you need and when the market is open, before you open your first chart.
1 lesson in English · 14 coming soonabout 6 min
Read 0/1
Stage 2 of 6
Tell trends, sideways markets and reversals apart, and draw support and resistance on a clean chart yourself.
5 lessons in English · 5 coming soonabout 30 min
Read 0/5
 2.1
What is a trend? How to read trends and draw trendlinesBeginner6 minNext lesson
Read
 2.2
What is a sideways market? Drawing the range and trading breakoutsBeginner6 minNext lesson
Read
 2.3
How to spot a trend reversal in 2 stepsBeginner5 minNext lesson
Read
 2.7
What is a trendline? Using it with a speed lineIntermediate6 minNext lesson
Read
 2.8
Multi-timeframe analysis: top-down from D1 to M5Intermediate7 minNext lesson
Read
Stage 3 of 6
Use RSI, EMA, Stochastic and Fibonacci to confirm your entries.
6 lessons in English · 3 coming soonabout 40 min
Read 0/6
 3.1
RSI: finding entries with overbought, oversold and RSI divergenceBeginner7 minNext lesson
Read
 3.3
Divergence: reading RSI signals for a pause or a reversalIntermediate8 minNext lesson
Read
 3.4
Fibonacci (FIBO): entering at the end of a wickIntermediate7 minNext lesson
Read
 3.5
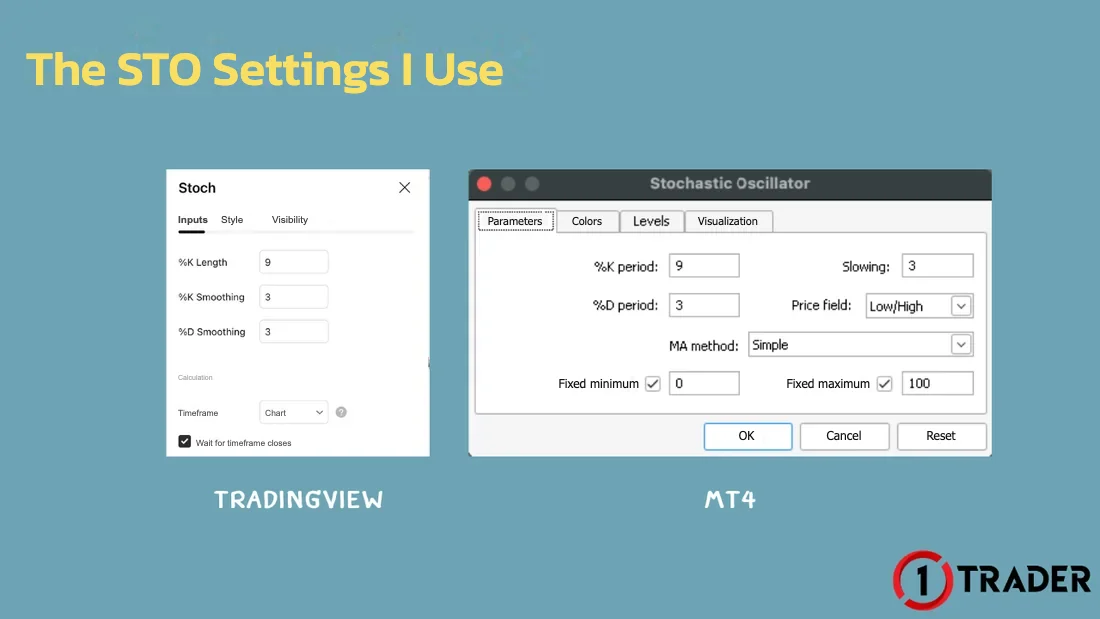
Stochastic (STO): 3 ways to find entriesIntermediate6 minNext lesson
Read
 3.6
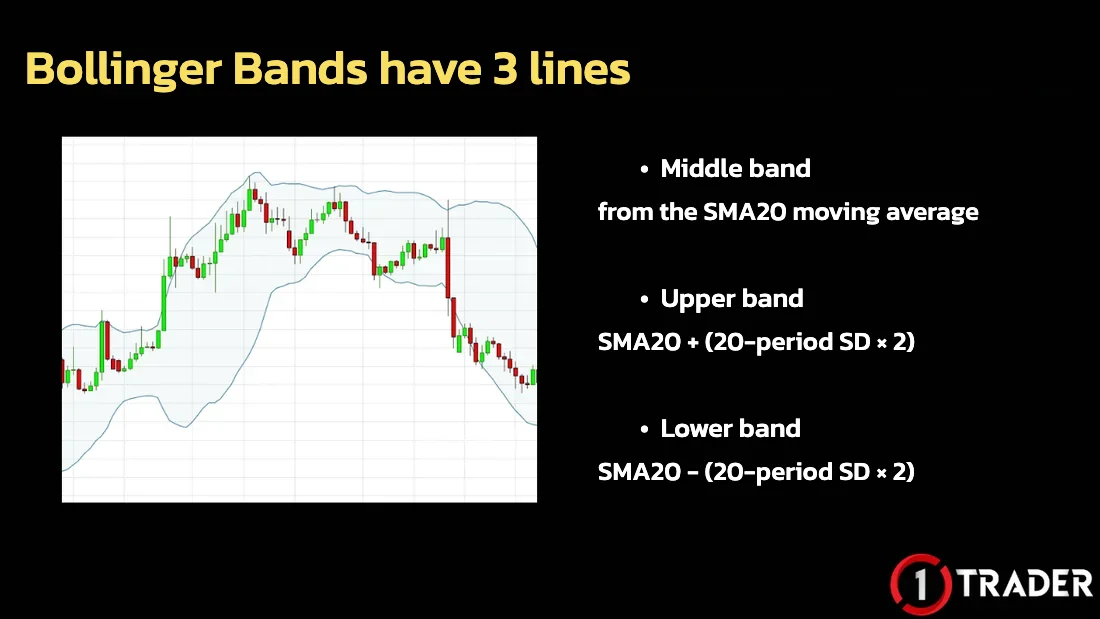
Bollinger Bands: finding entries with BB breakoutsIntermediate5 minNext lesson
Read
 3.7
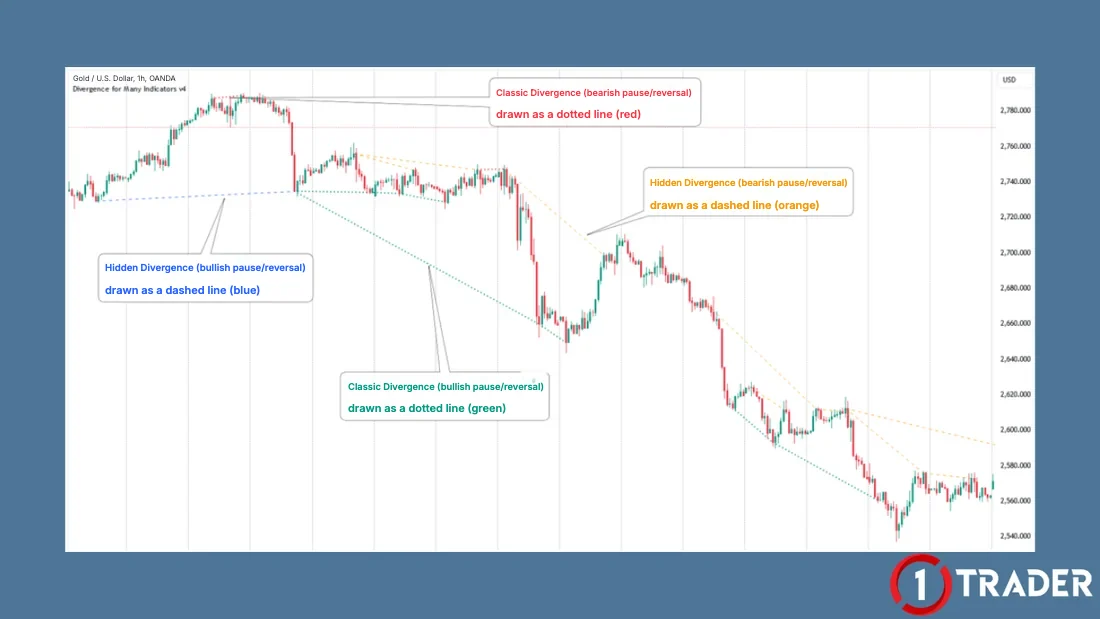
Free divergence indicators for TradingView and MT4Intermediate7 minNext lesson
Read
Stage 4 of 6
Draw demand and supply zones, order blocks and FVGs to find entries with an edge.
3 lessons in English · 2 coming soonabout 19 min
Read 0/3
 4.1
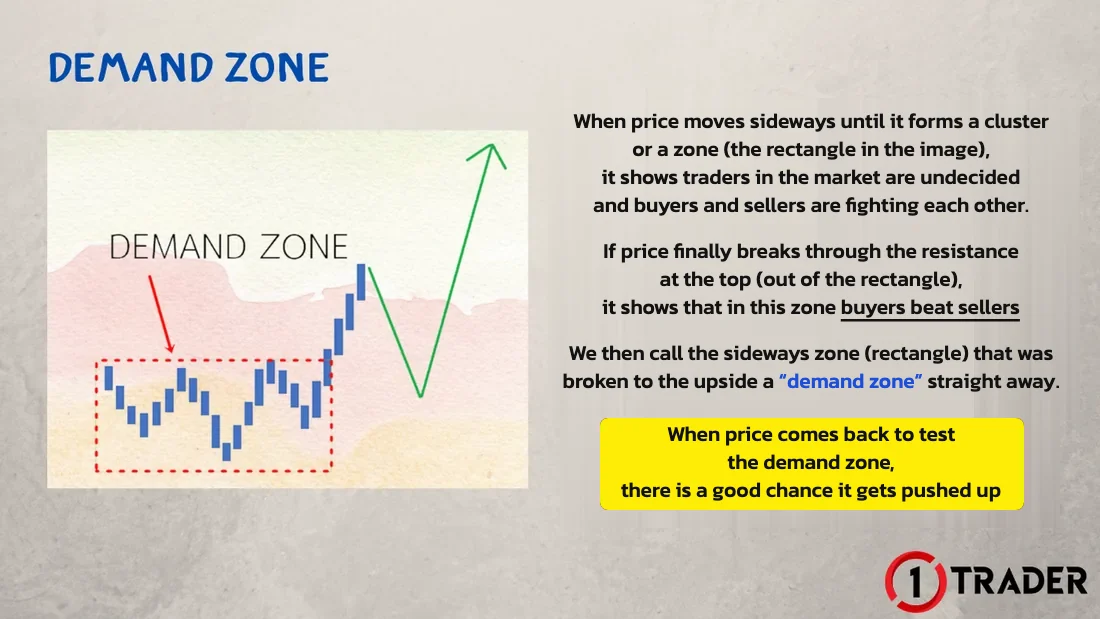
Demand and supply zones: how to trade them, plus order blocksIntermediate7 minNext lesson
Read
 4.2
Fair value gap (FVG): drawing the zone and finding entriesIntermediate6 minNext lesson
Read
 4.3
Free MT4 indicator for demand/supply zones, order blocks and FVGIntermediate6 minNext lesson
Read
Stage 5 of 6
Calculate your lot size from the amount you are willing to lose, set risk/reward and journal every trade.
2 lessons in English · 2 coming soonabout 14 min
Read 0/2
 5.1
Money management: managing risk and calculating lot sizeBeginner7 minNext lesson
Read
 5.4
Sniper (all-in) trading: does it work, or is it gambling?Intermediate7 minNext lesson
Read
Stage 6 of 6
Practise on TradingView and backtest, check the news calendar, then break down real trades.
2 lessons in English · 5 coming soonabout 13 min
Read 0/2
 6.1
How to use TradingView for free: sign-up, charts, tools and limitsBeginner7 minNext lesson
Read
 6.3
Backtesting: free sites FXReplay and FastBullIntermediate6 minNext lesson
Read
No lessons match your search
Try a shorter word such as “RSI” or “zone”, or see the Forex glossary
Use with the lessons
Cut costs from your first trade
95%$12.83/lot gold
Paid daily, automatically
90%$18/lot gold
Paid daily, automatically
95%$14.25/lot gold
Paid daily, automatically
% = maximum share of the IB commission paid back · gold rebate per lot (HFM Premium account) · Trading carries a high level of risk · 1TRADER is an IB partner of these brokers · Rates as of Sep 2026 and may change with each broker’s terms
Review
Many beginners start by hunting for trading signals or indicators, but the foundation that works with every strategy is reading price structure: is price in an uptrend, a downtrend or moving sideways? This course teaches that step by step with real gold charts. Read the recap before you start, or use it to review once you finish.
0/5 done
Draw lines on past gold charts across several timeframes, then practise placing orders on a demo account. Every time you enter, set your stop loss from the line you drew and size the order from the amount you are willing to lose.
Note US releases such as NFP, CPI and FOMC can easily push price through your lines with false breaks. Check this week’s release times on the 1TRADER homepage before you trade each day.
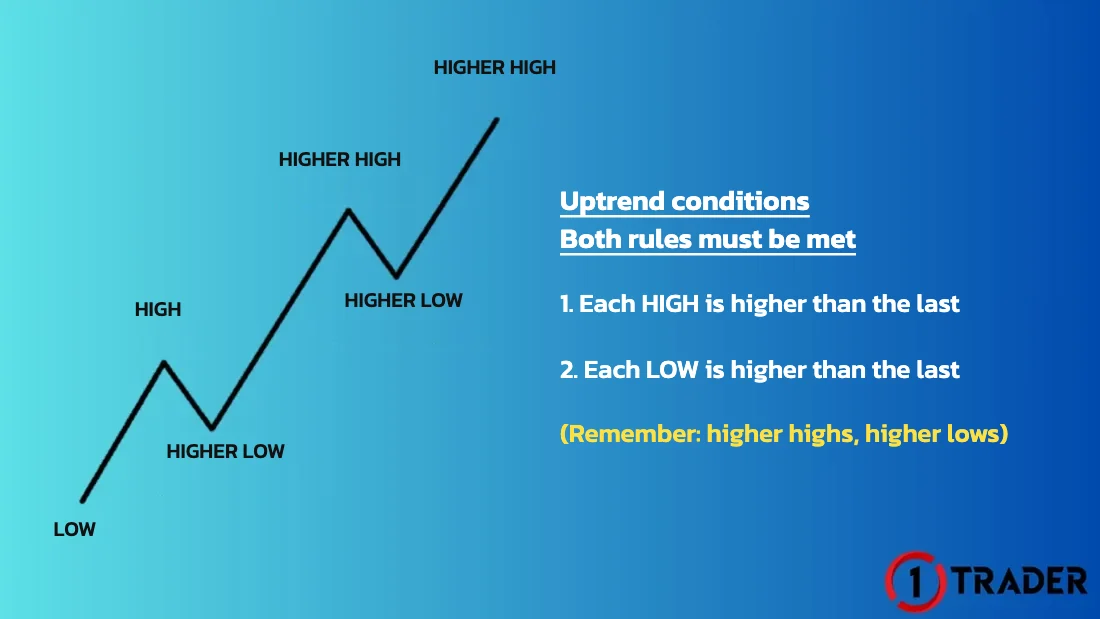
An uptrend is when price makes a new high above the previous one (higher high) and a new low above the previous one (higher low). A downtrend is the opposite. An uptrend line runs through at least 2 lows and a downtrend line through at least 2 highs. Use it as a guide to enter with the trend.
Note A line that price has touched and bounced off several times is more reliable than one with only 2 touches, and it does not have to pass through every wick. Draw it through the points the market sees most clearly.
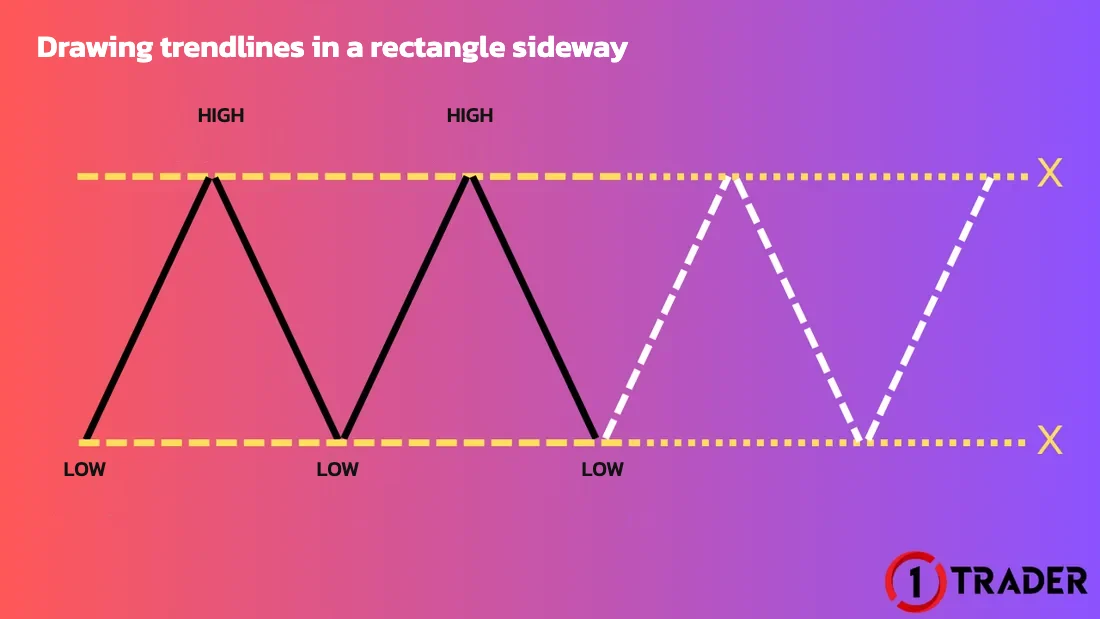
When price stops making new highs or lows and swings between support and resistance, the market is moving sideways. You can trade it two ways: bounce trades inside the range, or wait for price to break out of the range (breakout) and come back to test the old edge (retest).
Note False breakouts are common, especially around big news. Waiting for a candle to close outside the range or for a retest helps you avoid entering at the wrong time, even if your entry price is slightly worse.
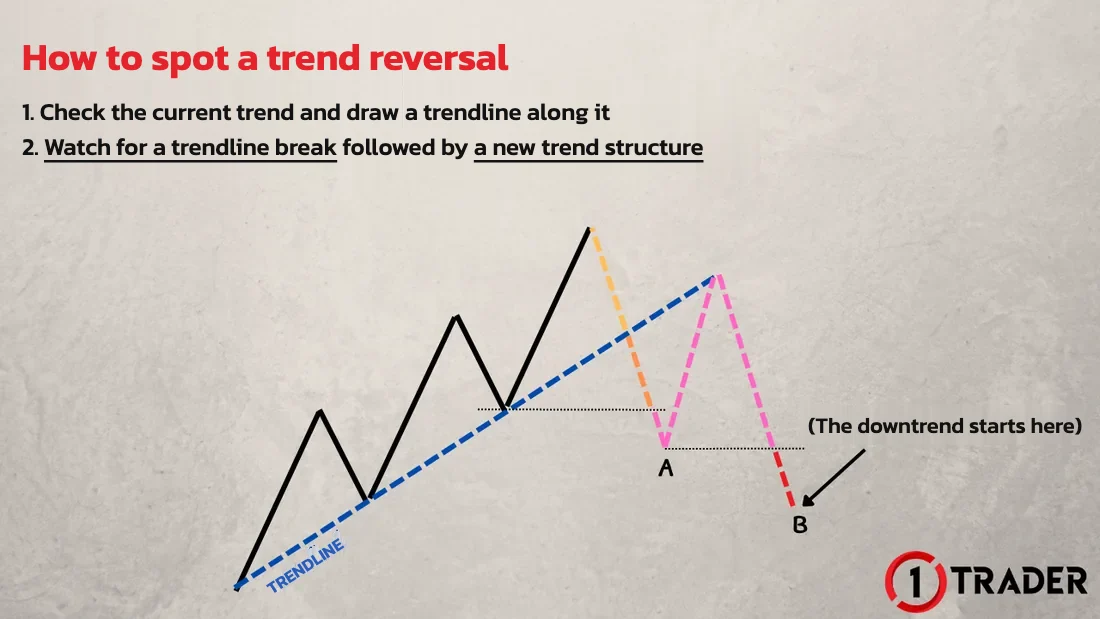
The first sign of a reversal is price breaking the old trendline, but you need to read the structure too. For example, an uptrend starts to change when price makes a lower high and breaks the latest higher low.
Note A trendline break on its own is not always a reversal. Price may just move sideways before continuing in the same direction, so wait for the structure to change clearly.
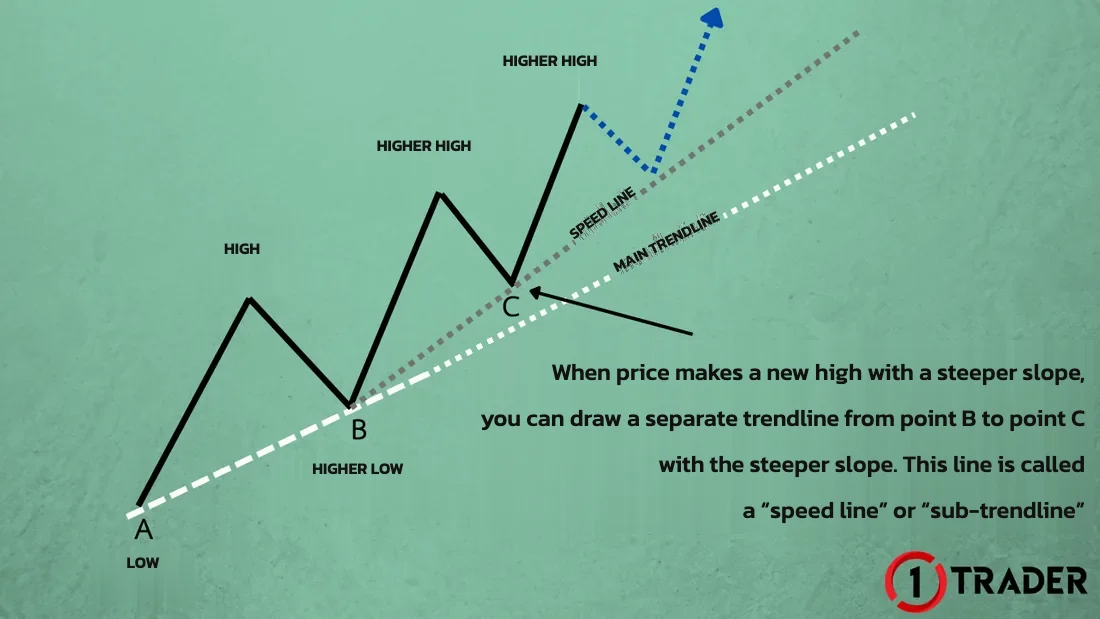
The main trendline shows the big direction, while the speed line is a sub-trendline that follows price’s latest run. When price pulls back and then breaks the speed line back in the direction of the main trend, it is an entry with the trend that allows a tighter stop loss.
Note Only trade speed line signals that go the same way as the main trend. Moves against the main trend are usually just pullbacks, not reversals.
A sideways range that price breaks out of strongly to the upside is a demand zone, and one it breaks to the downside is a supply zone. When price comes back to test the zone, enter with the trend and place your SL outside the zone. If the zone is broken, it flips its role straight away. An order block uses the single candle before a strong break instead of the whole range.
Note Only use zones on the same side as the trend: demand zones in an uptrend, supply zones in a downtrend.
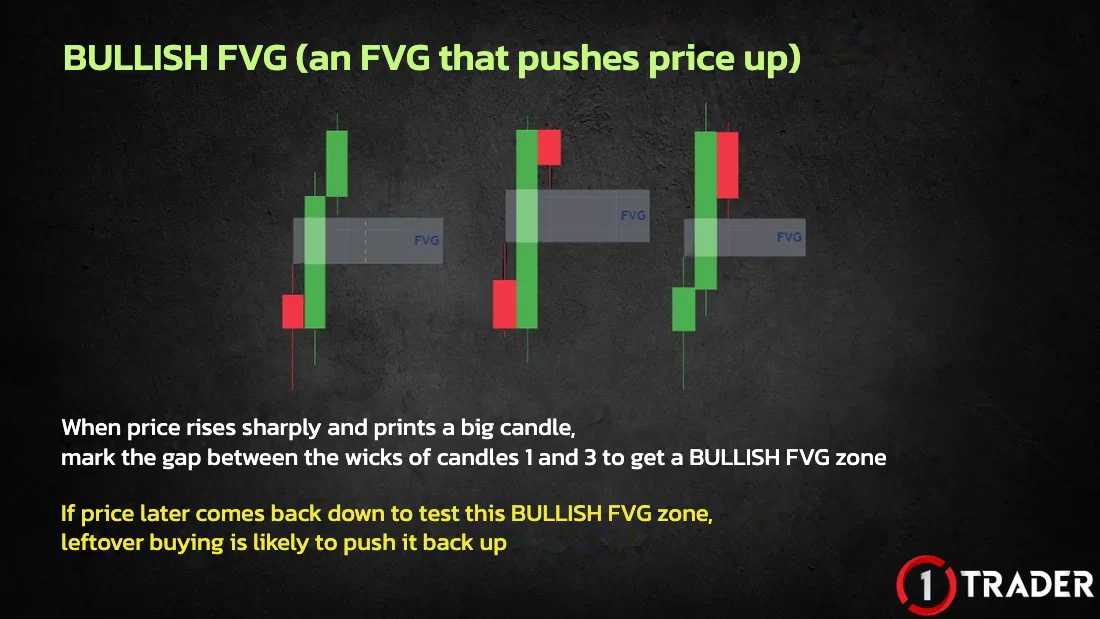
When candle 2 moves so strongly that the wicks of candles 1 and 3 do not overlap, the gap between them is a fair value gap (FVG). A long green candle gives a bullish FVG (support) and a long red candle gives a bearish FVG (resistance). When price comes back to test the gap, enter with the trend and place your SL outside the zone.
Note Delete a bullish FVG as soon as price closes below its bottom edge, because no leftover buying is left to support price.
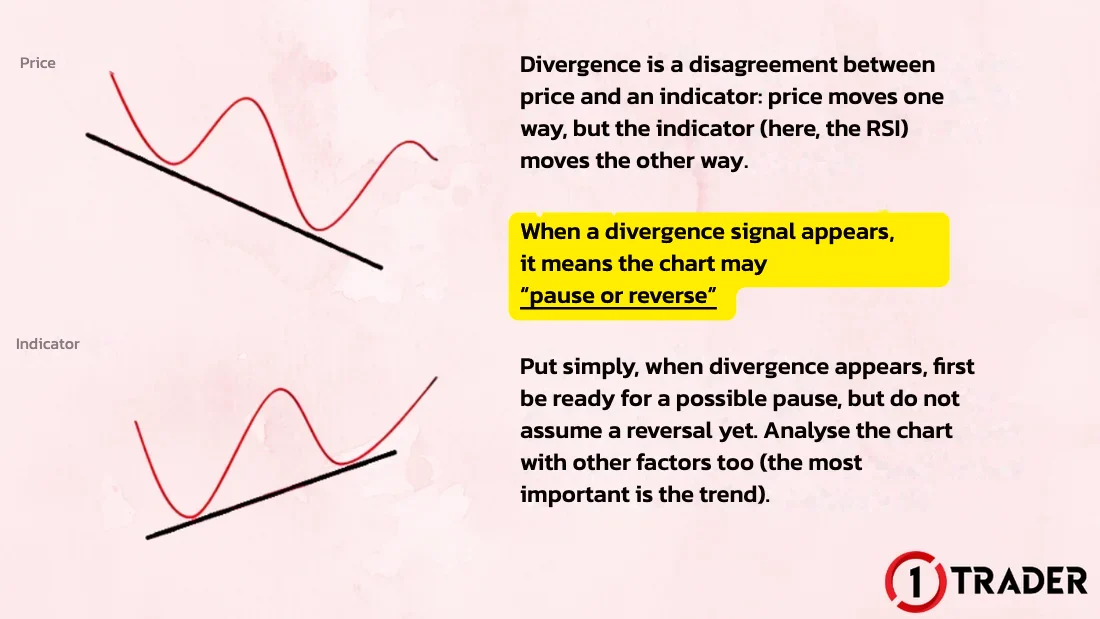
Divergence is when price and the RSI move in opposite directions. Classic divergence: price makes a lower low while the RSI makes a higher low (or a higher high against a lower RSI high). Hidden divergence is the reverse. Either way it signals a possible pause or reversal, not a guaranteed reversal.
Note First expect price to pause to the nearest support or resistance, and confirm a reversal only when the trend structure changes. Always check the higher timeframe.
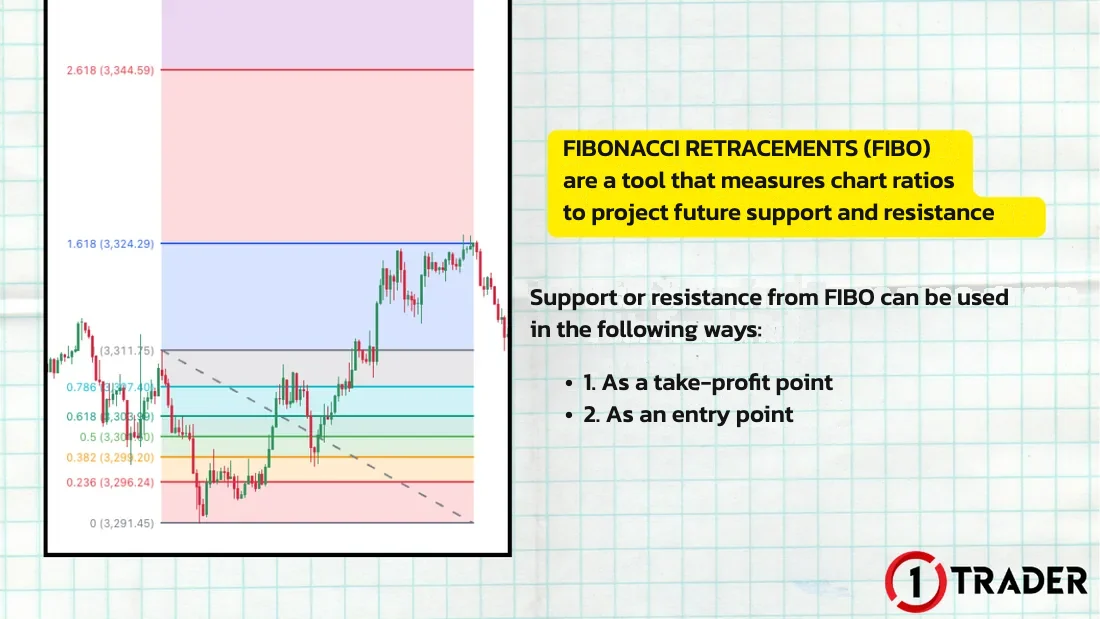
Once price breaks a high or a low, draw FIBO on the previous swing (the trend head) from wick to wick. The 1.618, 2.618, 3.618 and 4.236 extension levels become targets for taking profit with the trend, or possible wick-tip entries against it.
Note An entry at a FIBO level is always counter-trend. Only take it with M5 divergence and a higher-timeframe supply, demand or FVG zone.
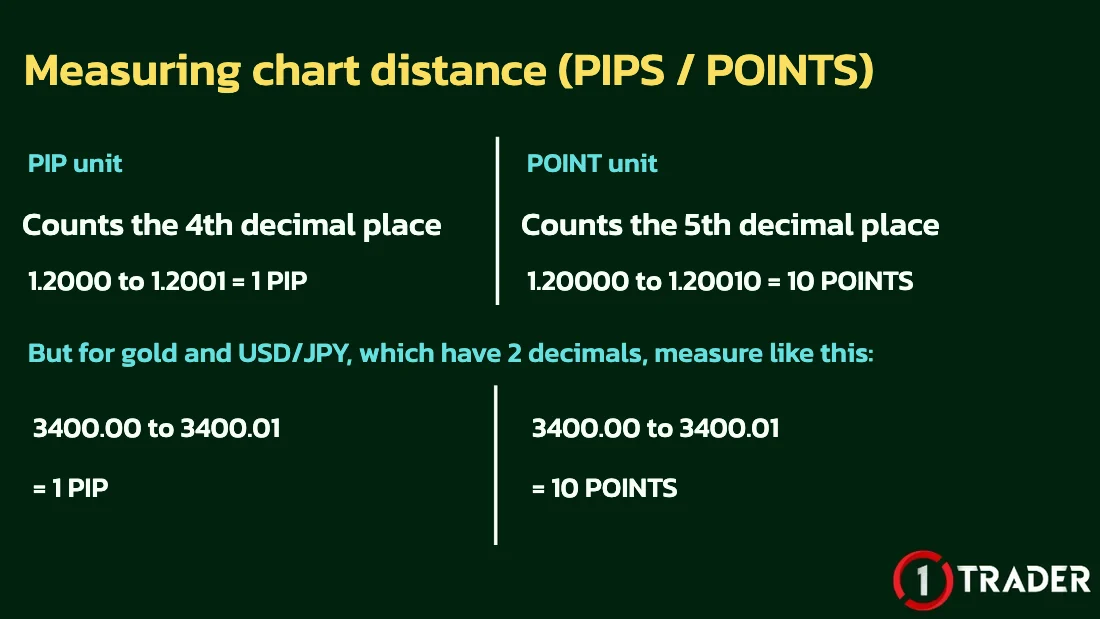
Measure distance in pips (1 pip = 10 points; on gold 1 pip = 0.01), work out profit and loss with pip value × lot size × pips, then size every trade backwards: lot size = amount you are willing to lose ÷ (SL pips × pip value).
Note Keep the risk on each trade to about 1–5% of your account and always round the lot size down.
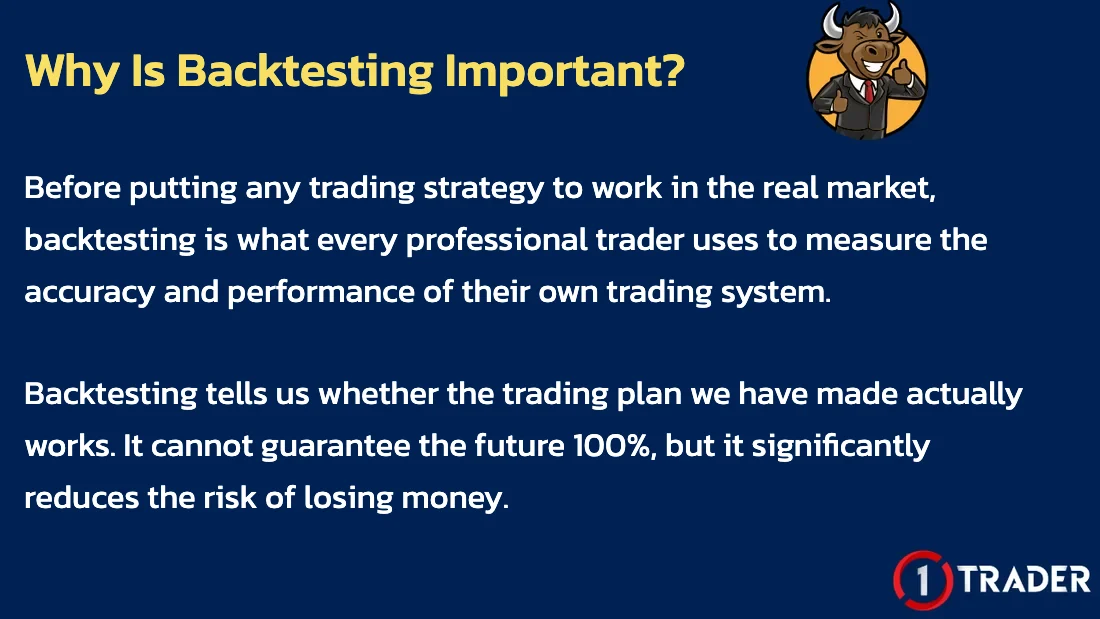
Backtesting means testing a strategy on past price data before risking real money. FXReplay lets you replay-trade with real order types (Buy/Sell, pending, SL/TP) and built-in stats on 2 free sessions. FastBull offers free Bar Replay on a TradingView chart once you share to unlock it.
Note Use the same entry and exit rules every time, never peek at future candles, and follow a good backtest with a demo account before trading live.
Stochastic compares the close with the high–low range of the last N candles on a 0–100 scale. With the 9/3/3 setting, look for three entry signals: above 80 / below 20 (overbought / oversold), %K crossing %D inside those zones, and divergence between price and STO.
Note In a strong trend STO can stay overbought or oversold for a long time. Plan the direction on the higher timeframe first and only take M5 signals on that side.
Bollinger Bands are an SMA20 middle band with upper and lower bands 2 standard deviations away, so they widen when volatility rises and narrow when it falls. On M5, a break below the lower band that closes back inside is a buy signal, and a break above the upper band that closes back inside is a sell signal.
Note In a strong trend price can ride a band for a long time. Only take the side that matches your higher-timeframe plan, and avoid big news releases.
You can start with about $10 if your plan’s SL fits the account. At lot 0.01, a 27.7-pip EUR/USD SL loses about $2.77, while a 1,100-pip gold SL loses $11, so that gold plan needs at least $20. Results come from your setup, your TP/SL and your risk management, not from the size of the account.
Note With $10–$20 at lot 0.01 the risk per trade is far above 1–2%. Treat it as a learning cost, or use a cent or demo account.
Sniper (All-in) means waiting for your most confident setup and sizing the lot so that hitting the SL loses your whole account: lot size = capital ÷ (SL pips × pip value). A $10 EUR/USD account with a 50-pip SL gives 0.02 lot, and a $30 gold account with a 100-pip SL gives 0.03 lot.
Note Stop out can close the trade before your SL, and at 50% accuracy only 12.5% of accounts survive 3 trades in a row. It is not for beginners; start at 1–2% risk per trade.
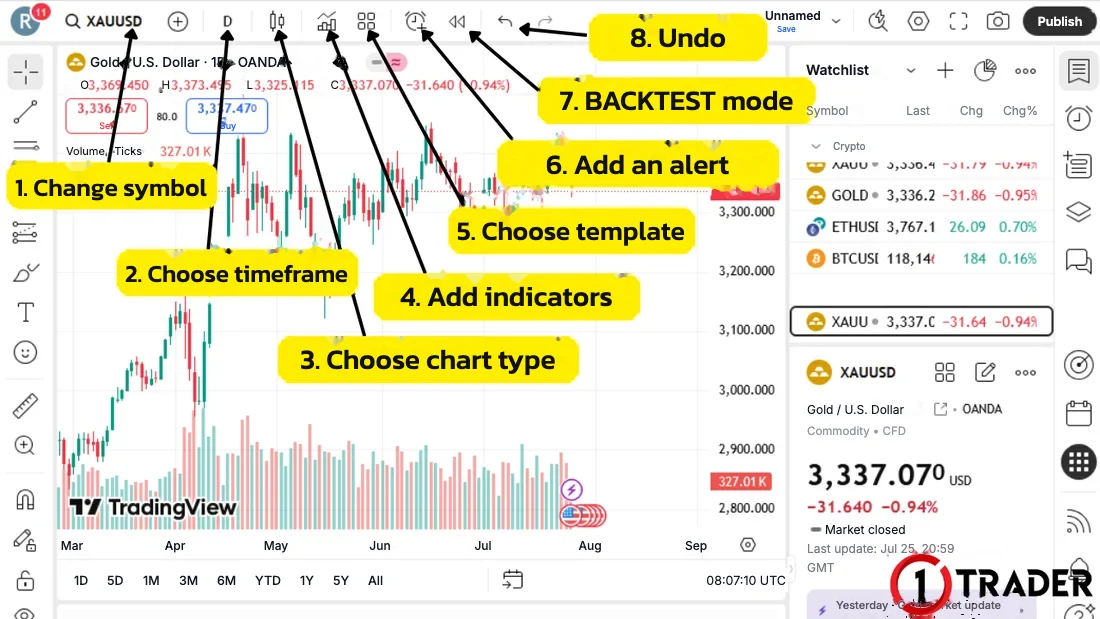
TradingView runs in your browser and its Basic plan is free with no credit card. Sign up with Google or email, search XAUUSD and open the chart, then learn the 3 toolbars: the top for symbol, timeframe, indicators and alerts, the left for drawing tools, and the right for the watchlist and object tree.
Note The free plan allows 2 indicators per chart, 1 chart per tab and 3 price alerts, based on TradingView’s pricing page as of Oct 2026. Stick with one price source close to your broker.
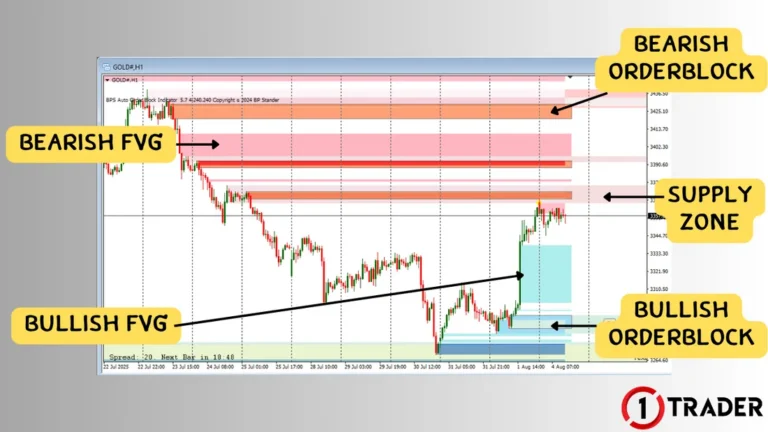
A free MT4 indicator and template that draws demand/supply zones, bullish and bearish order blocks and FVGs automatically. Install it in 5 steps: download, extract, copy the MQL4 and templates folders, paste them into the MT4 data folder, then load the Z_DemandSupplyAndOrderblock template and tick OB and FVG.
Note It works with MT4 only, not MT5. The zones are an aid, not signals: trade only zones that match the higher-timeframe trend, wait for confirmation and always set a stop loss.
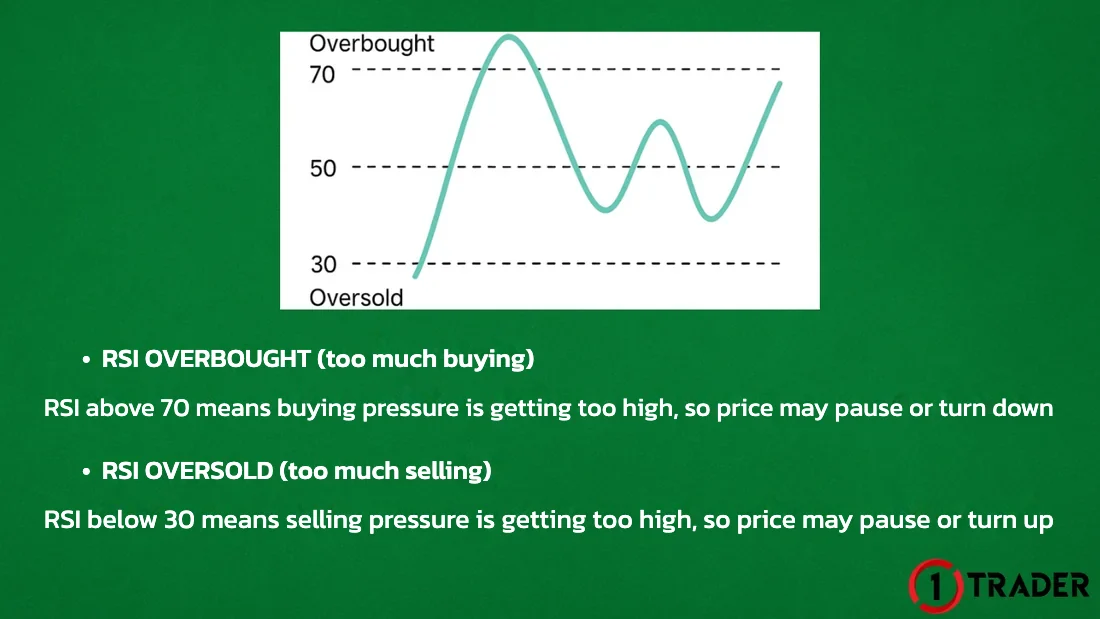
RSI measures buying and selling pressure from 0–100, with a standard setting of 14 and levels at 70/30. Consider selling when RSI is above 70 and turning down, or buying when it is below 30 and turning up, and use classic or hidden RSI divergence for earlier signals.
Note In a strong trend RSI can stay overbought or oversold for a long time. Trade only the side that matches the trend, at a zone, after a confirmation candle.
Two free indicators draw classic and hidden RSI divergence for you: RSI Divergence Indicator, installed in MT4 through Market with an MQL5 login, and Divergence for Many Indicators v4 on TradingView. Set them up step by step and read the coloured lines: dotted for classic, dashed for hidden.
Note Unconfirmed signals can change or disappear. Treat a line as a warning, check the trend and key zone, wait for a confirmation candle and always set a stop loss.
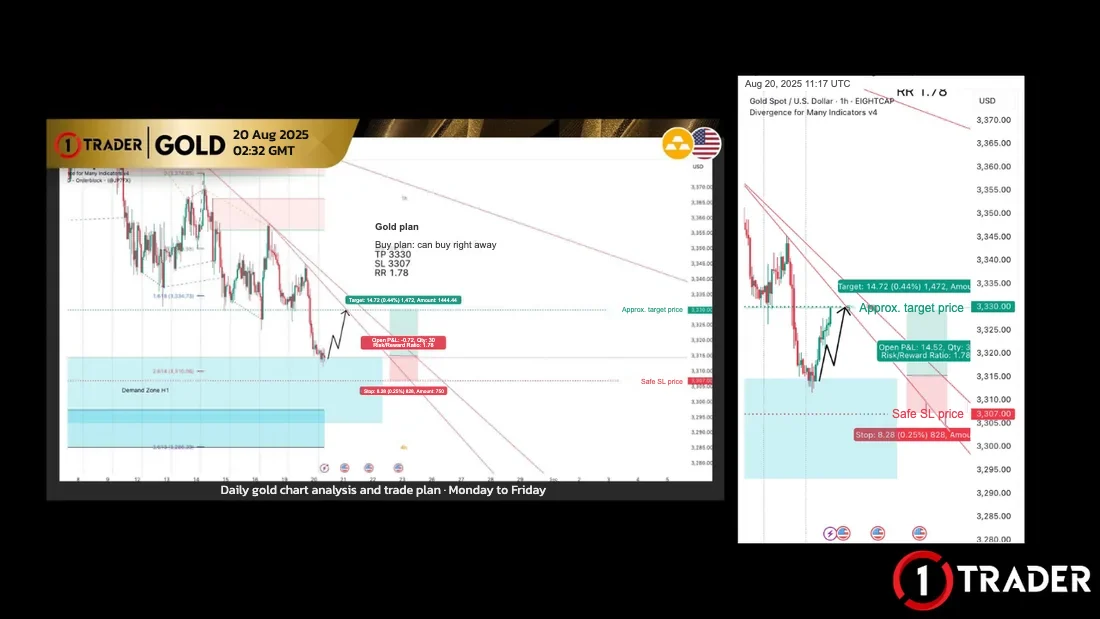
Read the same chart top-down: D1 for the main trend, H4 for the minor structure, H1 for confirmation and M5 for the entry and a tight stop loss. The big picture gives the direction, the small picture gives the entry timing, shown with a real gold buy plan at an H1 demand zone.
Note When timeframes disagree, follow the higher one. Stick to one set of 3–4 timeframes and use M5 only once price reaches your planned zone.
Summaries of the other lessons are added here as each English version goes live.
FAQ
Yes, it is completely free. You can start reading straight away with no sign-up and no personal details.
Start with the lessons available in English and follow the stages in order. Within each stage, easier lessons come first. The start button at the top always takes you to your next unread lesson when you come back.
We are translating the lessons one by one. As soon as a lesson’s English version is published, it appears on this page as a lesson card.
Only in your browser. A lesson counts as read when you open it from this page. If you switch devices or clear your browser data, your progress starts again.
No, you can start learning right away. When you are ready to practise, start with a demo account, and only use real money once you understand how to set your SL and lot size.
Yes. Trends, trendlines, sideways ranges and reversals work on Forex pairs and other assets too. Gold moves faster than most currency pairs, though, so allow a wider SL and use a smaller lot size.
Written and reviewed by the 1TRADER team · Updated 17 Oct 2026
Risk warning These lessons are for education and are not investment advice. Trading leveraged Forex and gold carries a high level of risk and you could lose all of your capital. Read the full risk disclosure.