
What Is Stochastic (STO)?
3 Ways to Find Trade Entries
Stochastic is an indicator that helps you find where price may pause or reverse. This lesson covers the 9/3/3 setting and finding entries with overbought/oversold, crossovers and divergence, with a real gold M5 trade example.
Quick summary before you read
- Stochastic (STO) compares the close with the high–low range of the last N candles and shows a value from 0 to 100, used to find where price may pause or reverse
- This lesson uses 9/3/3 · blue line = %K · orange line = %D
- 3 ways to find entries: overbought/oversold (above 80 / below 20) · crossovers (%K crosses %D) · divergence (price and STO move in opposite directions)
- Plan on the higher timeframe first, then wait for an STO signal on M5 in the same direction as your plan
Previous lessons: EP1 Trends · EP2 Sideways markets · EP3 Trend reversals · EP4 Speed line · EP5 Demand & supply zones · EP6 FVG · EP7 Divergence · EP8 FIBO · EP9 Money management · EP10 Free backtesting
What is Stochastic (STO)?
Stochastic (or STO) is a technical tool used in financial markets, both stocks and Forex, to help analyse price movement. STO compares the latest close with the highest and lowest prices over a set period.
The high and low in the formula are the highest and lowest prices of the last N candles (this lesson uses 9), so the value is always between 0 and 100. If price closes near the high of the range, the value approaches 100; if it closes near the low, it approaches 0.
STO 9/3/3 settings
Traders set Stochastic differently (the common default is 14/3/3), but this lesson uses STO 9/3/3 to find entries, because it is fast enough for a small timeframe like M5.
TradingView
- %K Length
- 9
- %K Smoothing
- 3
- %D Smoothing
- 3
MT4
- %K period
- 9
- %D period
- 3
- Slowing
- 3 · Price field: Low/High · MA method: Simple
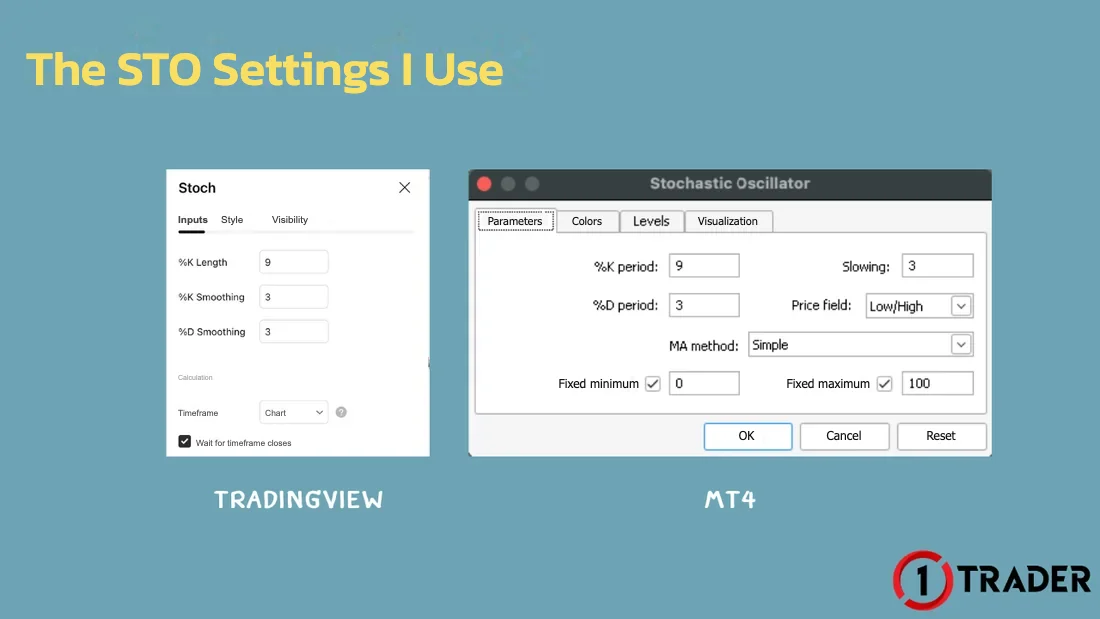
The field names differ but mean the same thing: %K Smoothing in TradingView = Slowing in MT4, and %D Smoothing = %D period.
3 ways to use STO to find entries
You can use Stochastic to find entries in 3 ways. One signal alone is enough to enter, but when several signals appear together, the chance that price follows your plan is higher.
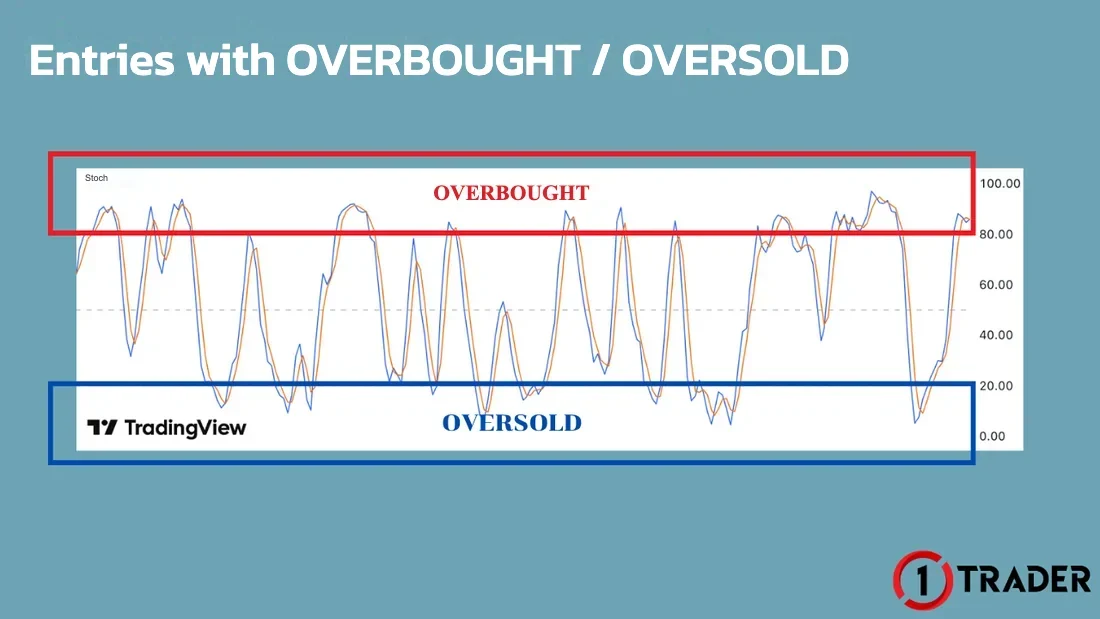
1. Entries with overbought / oversold
The market is in a phase where price is overbought and may pause or reverse down.
The market is in a phase where price is oversold and may pause or reverse up.
2. Entries with crossovers
%K (blue line) crosses %D (orange line) from below in the oversold zone
%K (blue line) crosses %D (orange line) from above in the overbought zone
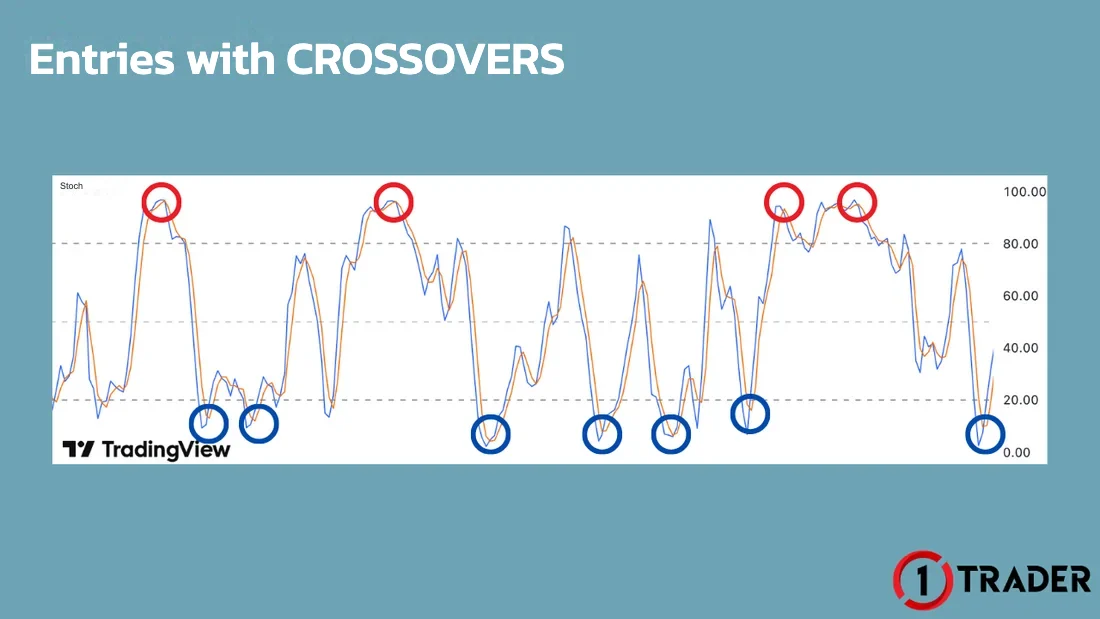
Some platforms show the %D line in red, so go by the line names in the settings window.
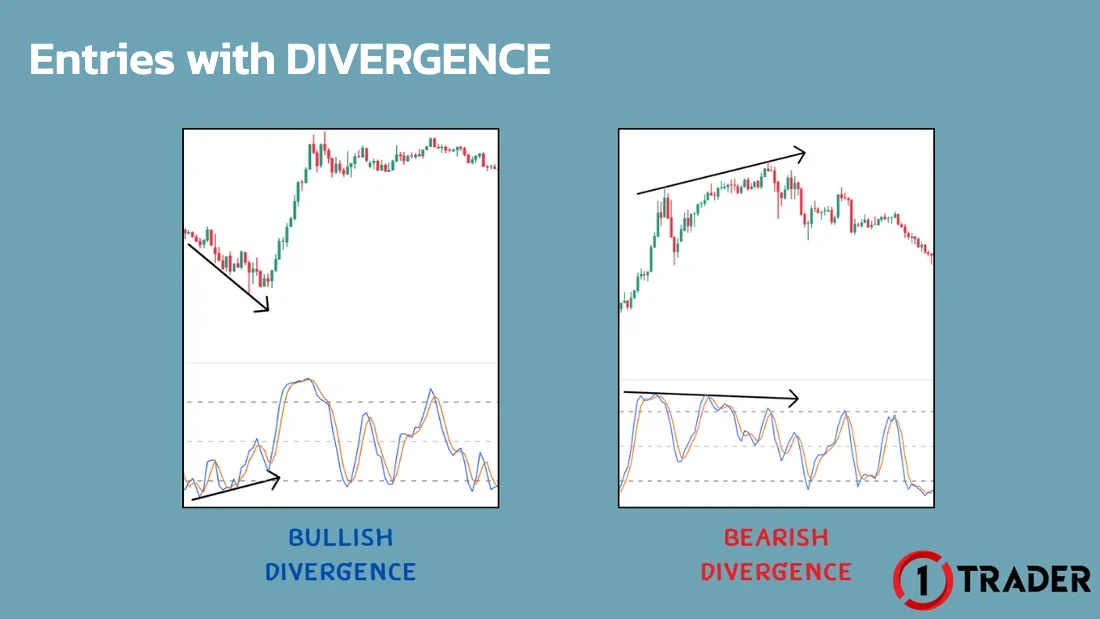
3. Entries with divergence
Divergence between price and Stochastic signals a possible change in price direction (the same idea as divergence in EP7, using STO instead of RSI).
Steps to use STO for M5 entries
Real example: gold sell plan, 26 Jun 2025
That day the gold plan was a sell plan, because H4 was in a downtrend, so any rise was treated as a pullback before the next leg down. The resistance to watch was the H1 supply zone (the orange zone at the top).
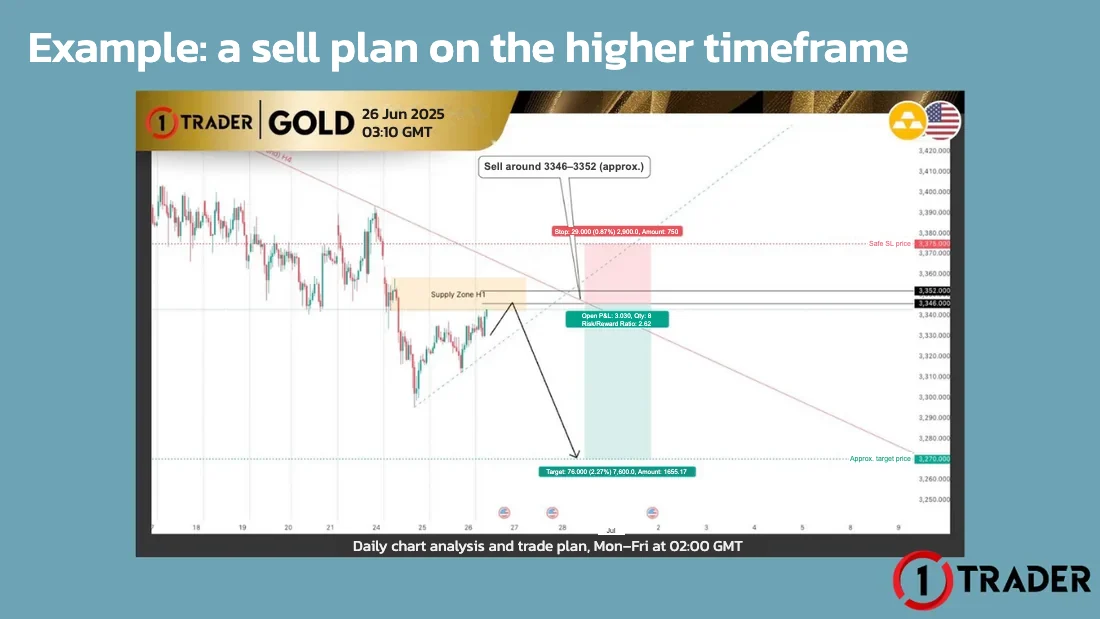
Next, we waited for an STO signal on M5. Later that day price rose into the H1 supply zone and gave three STO sell signals at the same time.
So we sold right away (one signal is enough to enter, but this time there were 3, so the chance of a drop was high), and price fell as the sell plan expected.
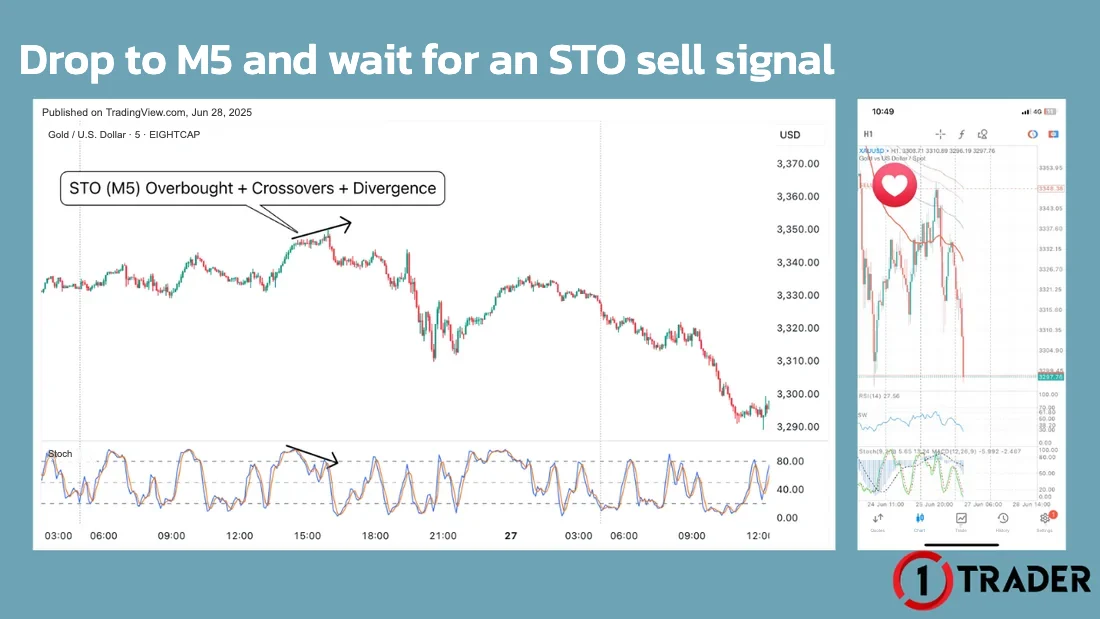
In a strong trend, Stochastic can stay overbought or oversold for a long time. Don’t trade against the trend just because STO enters a zone. Only take signals on the side that matches your higher-timeframe plan, always set an SL, and size your lot with money management.
Stochastic BUY / SELL signal summary
| Method | BUY signal | SELL signal | Watch out |
|---|---|---|---|
| Overbought / Oversold | STO below 20 | STO above 80 | Strong trends can stay in the zone for a long time |
| Crossovers | %K crosses above %D when oversold | %K crosses below %D when overbought | Crosses mid-range (30–70) are weak signals |
| Divergence | Price lower low · STO higher low | Price higher high · STO lower high | Signals a possible pause or reversal, not a sure reversal |
| M5 steps | Higher-timeframe plan is BUY | Higher-timeframe plan is SELL | Wait for price to reach your planned zone |
The key to Stochastic is to use it to time entries, not to set direction. Plan from the trend and zones on the higher timeframe first, then wait for STO to signal on M5; several signals together carry more weight. Before using it live, backtest it for free with the same rules on enough trades.
FAQ about Stochastic
What is Stochastic (STO)?
Stochastic, or STO, is an oscillator that compares the latest close with the high–low range over a set period. It shows a value from 0 to 100 and is used to find where price may pause or reverse.
What Stochastic settings should you use?
Settings vary by trader. This lesson uses 9/3/3 to find entries: in TradingView set %K Length 9, %K Smoothing 3, %D Smoothing 3; in MT4 set %K period 9, %D period 3, Slowing 3.
What levels are overbought and oversold on Stochastic?
Stochastic above 80 is the overbought zone, where price may pause or reverse down. Below 20 is the oversold zone, where price may pause or reverse up.
How do you read Stochastic crossover signals?
When %K crosses %D from below in the oversold zone, it is a buy signal. When %K crosses %D from above in the overbought zone, it is a sell signal.
What is Stochastic divergence?
It is when price and Stochastic move in opposite directions. For example, price makes a new high but Stochastic does not (bearish divergence), showing that buying pressure is fading and price may pause or reverse down.
How do you use Stochastic to find entries on M5?
Plan on the higher timeframe first whether to focus on BUY or SELL that day, then drop to M5 and wait for an STO signal that matches the plan. For a sell plan, wait for overbought, a downward crossover or bearish divergence at your planned resistance.
Can you sell as soon as STO is overbought?
Don’t use it alone. In a strong trend, Stochastic can stay overbought or oversold for a long time. Trade in the higher-timeframe direction and wait for price to reach your planned zone; the more signals line up, the better the odds.
Read EP10 again Next lesson · EP12 What Are Bollinger Bands? How to Find Entries with a BB Breakout SMA20 ± 2 SD · break out and close back inside · gold M5 example
Read EP12 →
See all lessons in the free Forex and gold trading course
Risk warning: Trading Forex, gold and CFDs carries a high level of risk and you may lose money. 1TRADER provides information and education to support your own decisions only. The trade examples in this article use historical data and do not guarantee future results. Read the full risk disclosure.