
What Are Bollinger Bands?
How to Find Entries with a BB Breakout
Bollinger Bands show price volatility and help you find entries and exits. This lesson explains the 3 lines and how to enter when price breaks out of the bands and closes back inside, with a real gold M5 trade example.
Quick summary before you read
- Bollinger Bands (BB) show price volatility, using SMA20 together with the standard deviation (SD) to build upper and lower bands
- 3 lines: middle band SMA20 · upper band SMA20 + 2 SD · lower band SMA20 − 2 SD
- BB breakout: breaks the lower band then comes back inside = consider BUY · breaks the upper band then comes back inside = consider SELL
- Cut false signals by planning on the higher timeframe first, then finding entries on M5
Previous lessons: EP1 Trends · EP2 Sideways markets · EP3 Trend reversals · EP4 Speed line · EP5 Demand & supply zones · EP6 FVG · EP7 Divergence · EP8 FIBO · EP9 Money management · EP10 Free backtesting · EP11 Stochastic
What are Bollinger Bands?
Bollinger Bands (or BB) are a technical analysis tool that shows price volatility and helps you find entries and exits effectively. They were developed by John Bollinger.
When price is very volatile, the bands widen; when volatility is low, they narrow. Bollinger Bands can be used in many ways, but this lesson focuses on finding entries with a breakout.
The parts of Bollinger Bands
Bollinger Bands are made up of 3 lines:
- Middle
- Middle band: the SMA20 moving average
- Upper
- Upper band: SMA20 + (20-candle SD × 2)
- Lower
- Lower band: SMA20 − (20-candle SD × 2)
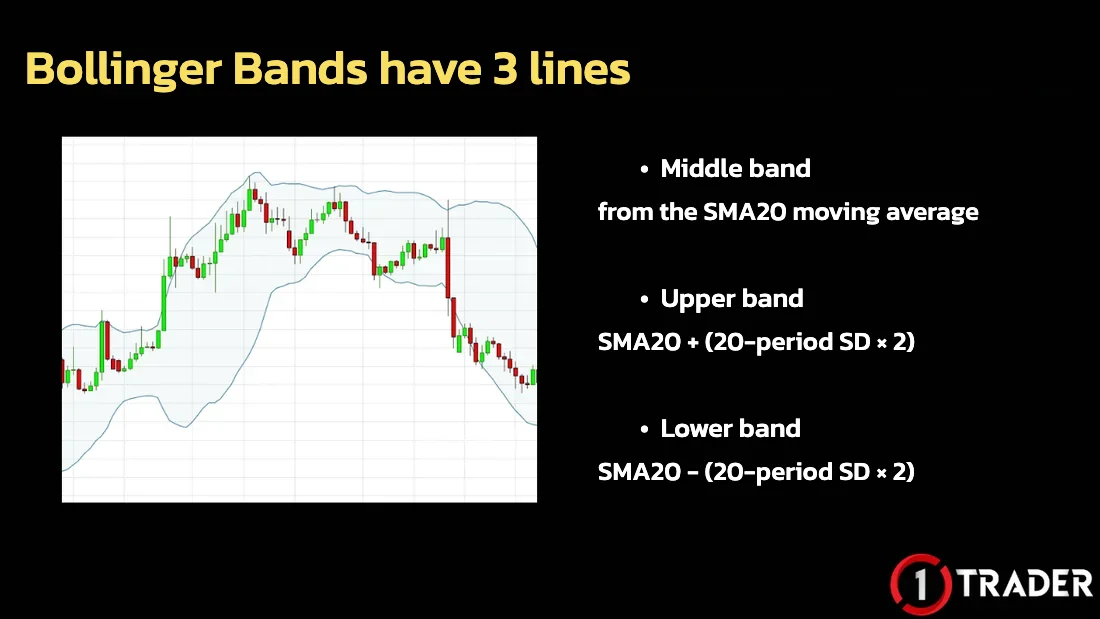
The 20 is the number of candles on the timeframe you use (on M5, the last 20 candles), not always 20 days. The standard 20, 2 setting is the default in TradingView and MT4.
Finding entries with a Bollinger Bands breakout
Bollinger Bands breakout entries are found on the M5 timeframe with these conditions:
Price breaks below the lower band and comes back inside the bands: you can consider opening a Buy
Price breaks above the upper band and comes back inside the bands: you can consider opening a Sell
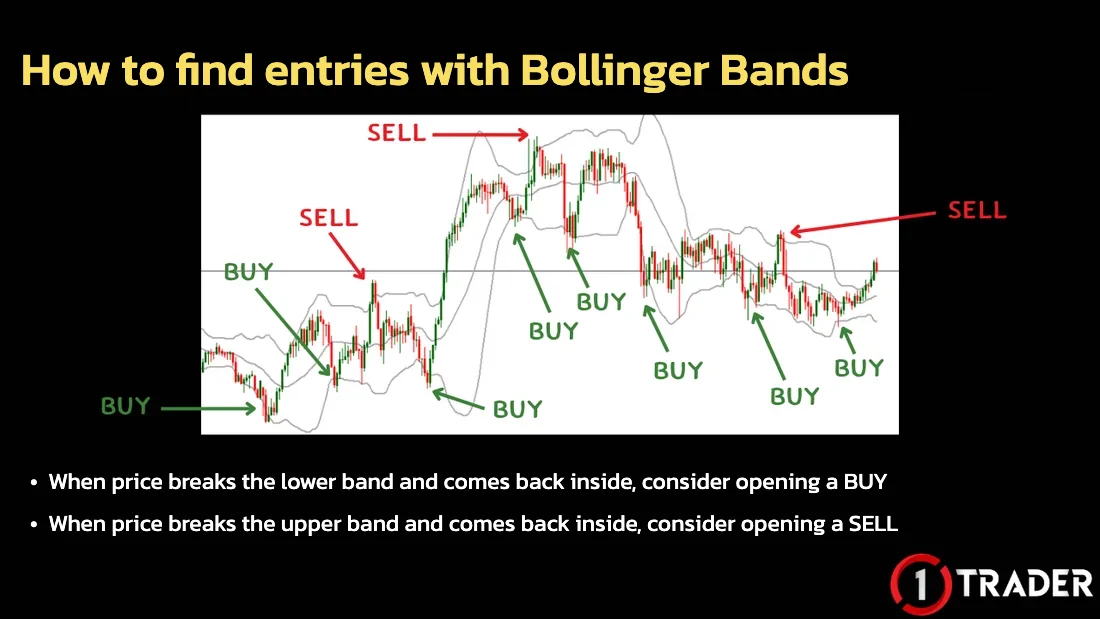
BB breakout entries need other factors to reduce the risk of false signals, especially in strong trends where price can keep riding the upper or lower band. The best way to lower risk and improve accuracy is to analyse and plan on the higher timeframe first, then drop to M5 to find the entry.
Steps to use a BB breakout for M5 entries
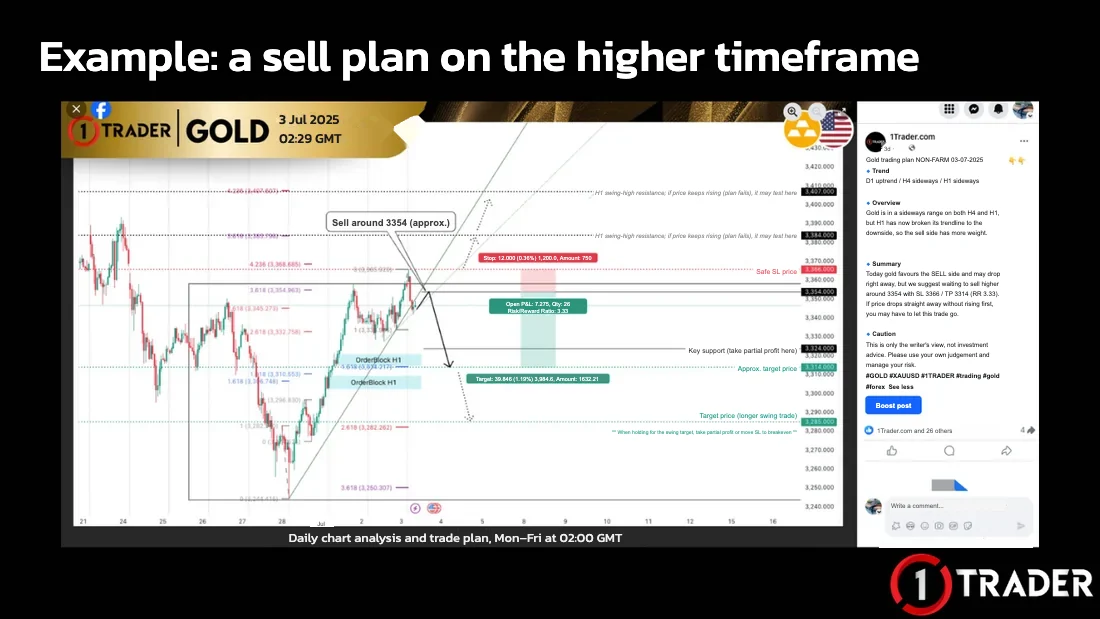
Real example: gold sell plan, 3 Jul 2025
That day the gold plan was a sell plan. The key reason was that H1 had broken below its uptrend line, so the sell side had more weight, with the SL above the top of the sideways range.
Next, we waited for a BB breakout on M5. Later that day price broke above the upper band around 3363, and when the next candle closed back inside the bands, we sold right away. Price then fell as planned.
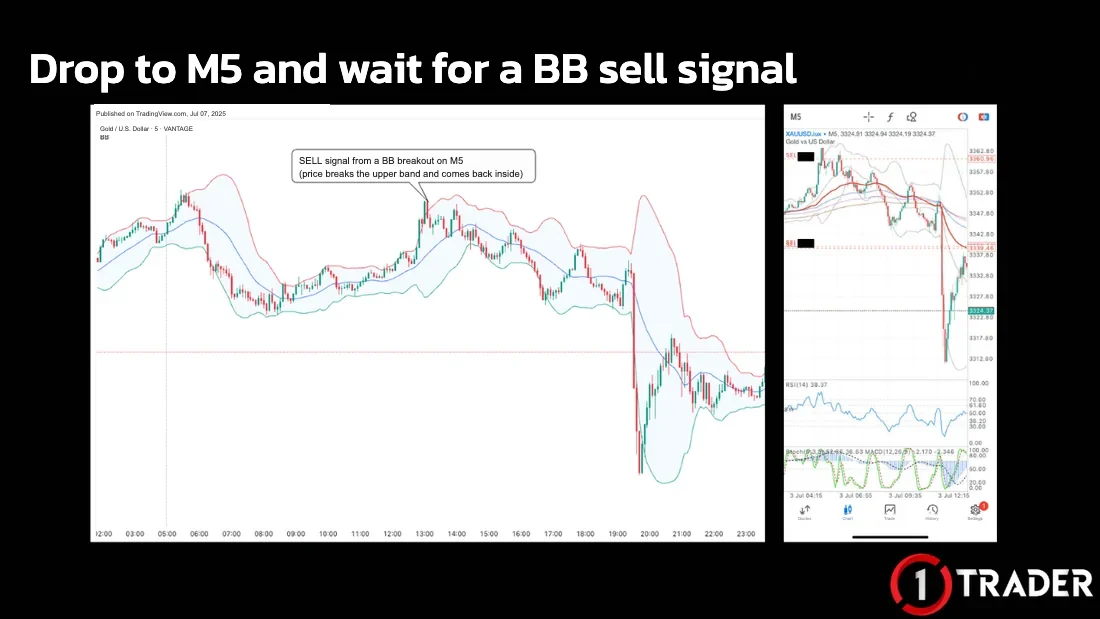
That day was a Non-Farm Payrolls (NFP) release. Around the 12:30 GMT release, price moved so sharply that the bands widened a lot. BB signals are often unreliable during big news, so check the economic calendar before trading, always set an SL, and size your lot with money management.
Bollinger Bands BUY / SELL signal summary
| Topic | BUY signal | SELL signal | Note |
|---|---|---|---|
| Band used | Lower band | Upper band | SMA20 ± 2 SD |
| Condition | Breaks the lower band, then closes back inside | Breaks the upper band, then closes back inside | Wait for a candle to close back inside first |
| Higher-timeframe plan | Plan is BUY | Plan is SELL | The best way to cut false signals |
| Watch out | In a strong downtrend price rides the lower band | In a strong uptrend price rides the upper band | Avoid major news releases |
The key to a Bollinger Bands breakout is to wait for price that broke out to close back inside the bands, and to trade only the side that matches your higher-timeframe plan. Combine it with Stochastic or divergence for extra weight, and backtest it for free before using it live.
FAQ about Bollinger Bands
What are Bollinger Bands?
Bollinger Bands (BB) are an indicator developed by John Bollinger. They use a moving average with the standard deviation (SD) to build bands above and below price, showing volatility and helping you find entries and exits.
How many lines do Bollinger Bands have, and how are they calculated?
There are 3 lines: the middle band is SMA20, the upper band is SMA20 + (20-candle SD × 2) and the lower band is SMA20 − (20-candle SD × 2), where 20 is the number of candles on the timeframe you use.
What do Bollinger Bands tell you about volatility?
When price is very volatile, the bands widen; when volatility is low, they narrow. A very tight squeeze is often followed by a strong move.
How do you find entries with a Bollinger Bands breakout?
When price breaks the lower band and comes back inside, consider a BUY; when price breaks the upper band and comes back inside, consider a SELL. Wait for a candle to close back inside the bands first.
Can you sell as soon as price breaks the upper band?
No. In a strong trend price can keep riding the upper or lower band for a long time. Wait for price to come back inside the bands, and trade only the side that matches your higher-timeframe plan.
Which timeframe should you use Bollinger Bands on?
In this lesson they are used to find entries on M5, after analysing and planning on the higher timeframe whether to trade BUY or SELL that day.
How can you reduce false Bollinger Bands signals?
The best way is to analyse and plan on the higher timeframe first, then wait for an M5 BB breakout that matches the plan at your planned support or resistance. Avoid major news releases and always set an SL.
Read EP11 again Next lesson · EP13 How Much Money Do You Need to Start Trading Forex? $10 Is Enough with a Plan 3 key factors · lot 0.01 maths · EUR/USD with $10 · gold with $20
Read EP13 →
See all lessons in the free Forex and gold trading course
Risk warning: Trading Forex, gold and CFDs carries a high level of risk and you may lose money. 1TRADER provides information and education to support your own decisions only. The trade examples in this article use historical data and do not guarantee future results. Read the full risk disclosure.