
What Is FIBO?
Entering at the Wick Tip with Fibonacci
FIBO (Fibonacci) is a tool that measures chart ratios to project support and resistance. Learn to draw FIBO levels at 1.618 · 2.618 · 3.618 · 4.236 and use them as TP targets and wick-tip entries, with real gold chart examples.
Quick summary before you read
- FIBO (Fibonacci) is a tool that measures chart ratios to project future support and resistance, used as take-profit points or entries
- High broken: draw FIBO on the uptrend head, from the top wick A down to the bottom wick B = resistance at 1.618 · 2.618 · 3.618 · 4.236
- Low broken: draw FIBO on the downtrend head, from the bottom wick A up to the top wick B = support at 1.618 · 2.618 · 3.618 · 4.236
- Entering at a FIBO level is always a counter-trend trade · wait for M5 divergence + an H1 supply/demand/FVG zone first
- Use it for TP targets on any timeframe · for entries, M5 is recommended to get wick-tip prices
Previous lessons: EP1 Trends · EP2 Sideways markets · EP3 Trend reversals · EP4 Speed line · EP5 Demand & supply zones · EP6 FVG · EP7 Divergence
What is FIBO?
Fibonacci retracements (FIBO) are a tool that measures chart ratios to project future support and resistance. There are many ways to draw FIBO, but this lesson uses it to find support and resistance levels to use as take-profit points or entries.
Before learning how to draw FIBO to project support and resistance, it helps to know where FIBO comes from.
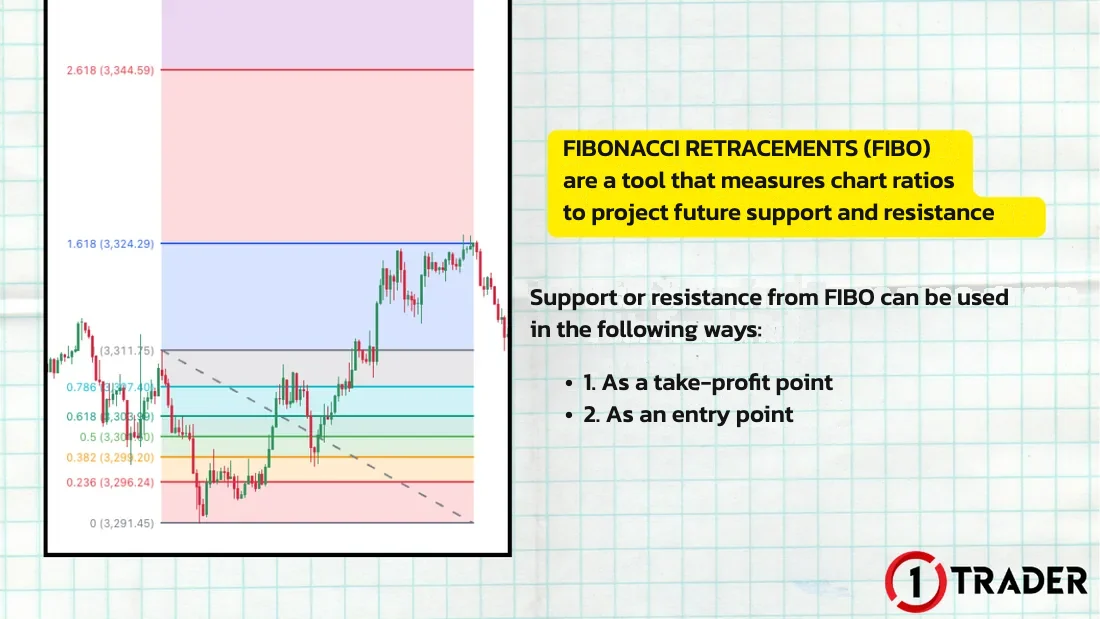
Where FIBO comes from and the key ratios
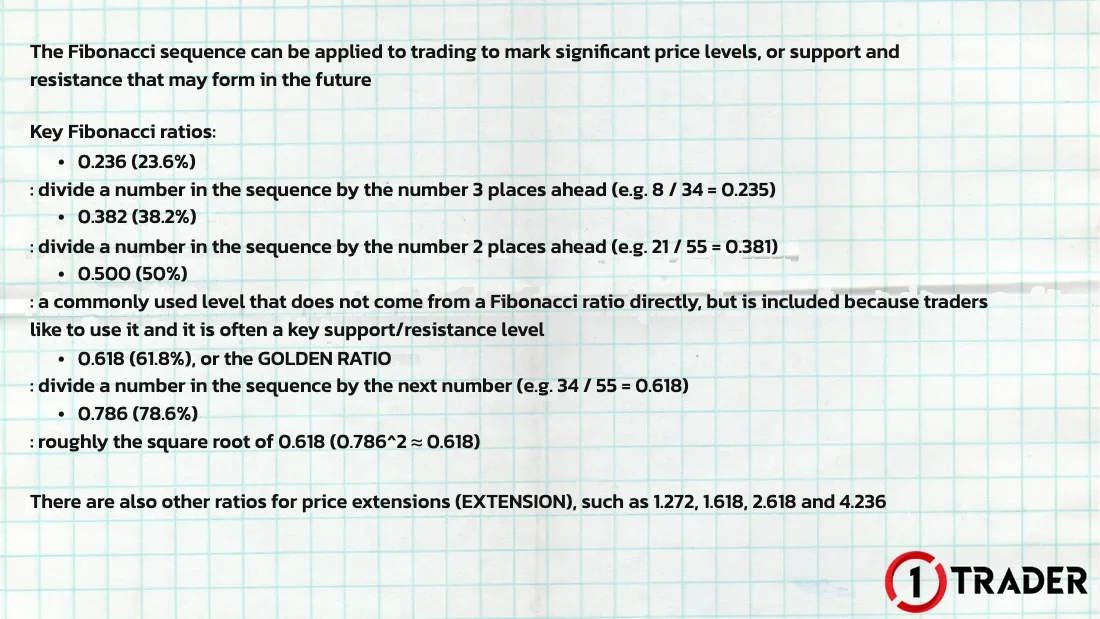
“FIBO”, better known by its full name “Fibonacci”, comes from Leonardo Pisano Fibonacci, a famous Italian mathematician of the 13th century.
He described a remarkable number sequence in which each number is the sum of the two numbers before it.
For example 0 + 1 = 1 · 1 + 1 = 2 · 1 + 2 = 3 · 2 + 3 = 5, and so on. Traders apply this sequence to mark significant price levels, or support and resistance that may form in the future.

Key Fibonacci ratios
There are also ratios for price extensions, such as 1.272, 1.618, 2.618 and 4.236.
Retracement levels (0.236–0.786) show how deep price may pull back, while extension levels show how far price may run. This lesson mainly uses the 1.618, 2.618, 3.618 and 4.236 extension levels to find trend targets.
Drawing FIBO for resistance and support
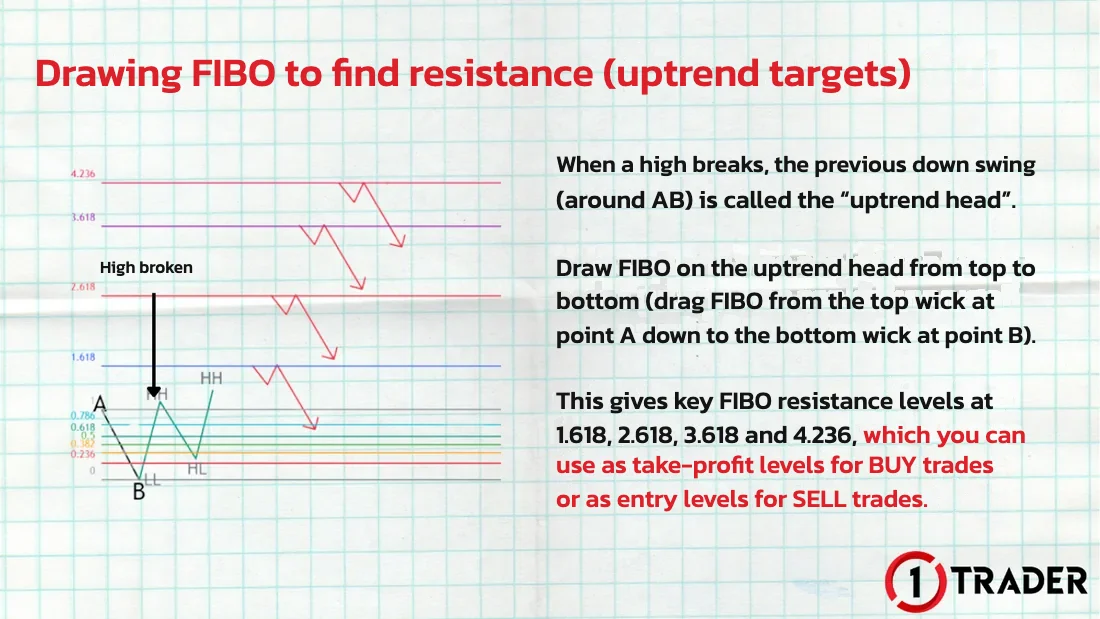
Drawing FIBO starts with waiting for price to break a high or a low, then drawing on the previous swing (A–B), which is called the “head” of the trend. Review highs and lows in EP1.
Draw FIBO for resistance
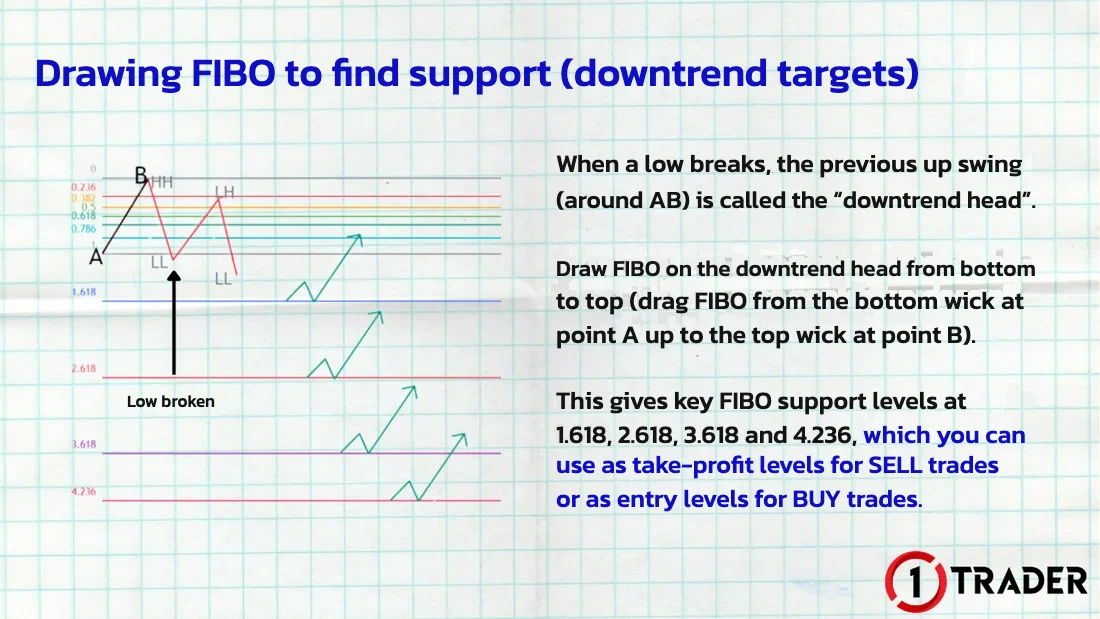
Draw FIBO for support
Drawing FIBO on a gold chart
FIBO for resistance (uptrend targets)
On this M5 chart price breaks a high, so the previous down swing (AB) is the “uptrend head”. Draw FIBO from the top wick at point A down to the bottom wick at point B to get resistance at 1.618, 2.618, 3.618 and 4.236, levels where price may pause or reverse down.
If the chart is in an uptrend and you hold a BUY, use these resistance levels as BUY take-profit points. You can also use them as SELL entries, but that trades against the current uptrend, so check other factors carefully, because not every level is good for a counter-trend SELL.
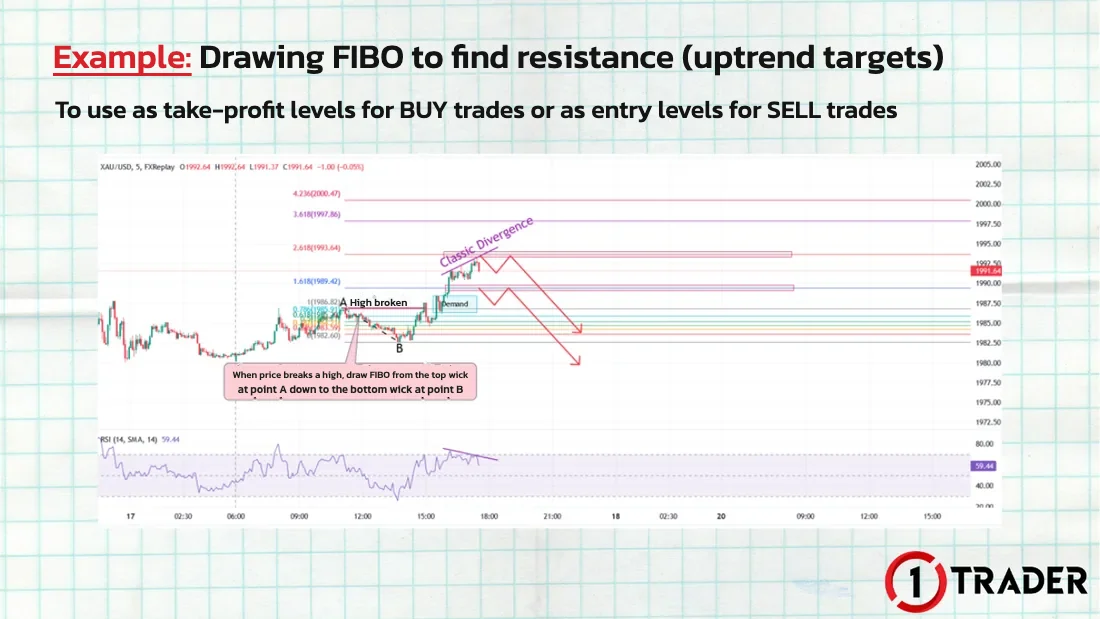
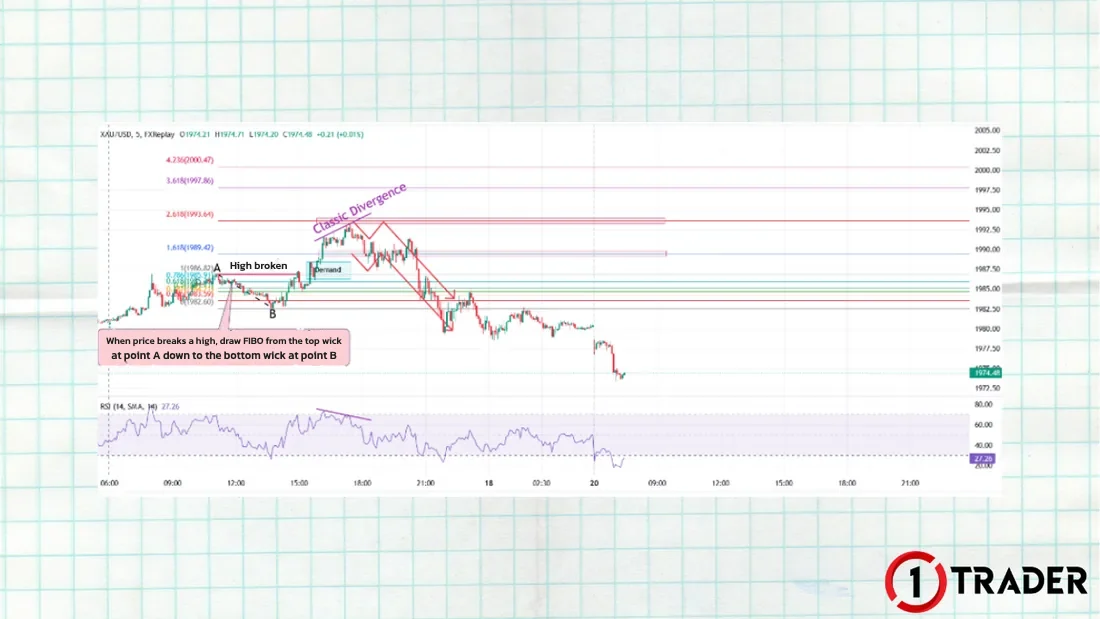
Which FIBO resistance levels are worth a counter-trend SELL?
For example, an M5 FIBO resistance level that also shows a divergence signal and lines up with a supply zone or FVG on a higher timeframe such as H1. Then you can consider a counter-trend SELL, with the SL above the next nearest FIBO resistance (FIBO entries don’t need a wide SL, because they often get wick-tip prices).
FIBO for support (downtrend targets)
On this M5 chart price breaks a low, so the previous up swing (AB) is the “downtrend head”. Draw FIBO from the bottom wick at point A up to the top wick at point B to get support at 1.618, 2.618, 3.618 and 4.236, levels where price may pause or reverse up.
If the chart is in a downtrend and you hold a SELL, use these support levels as SELL take-profit points. You can also use them as BUY entries, but that trades against the current downtrend, so check other factors carefully, because not every level is good for a counter-trend BUY.
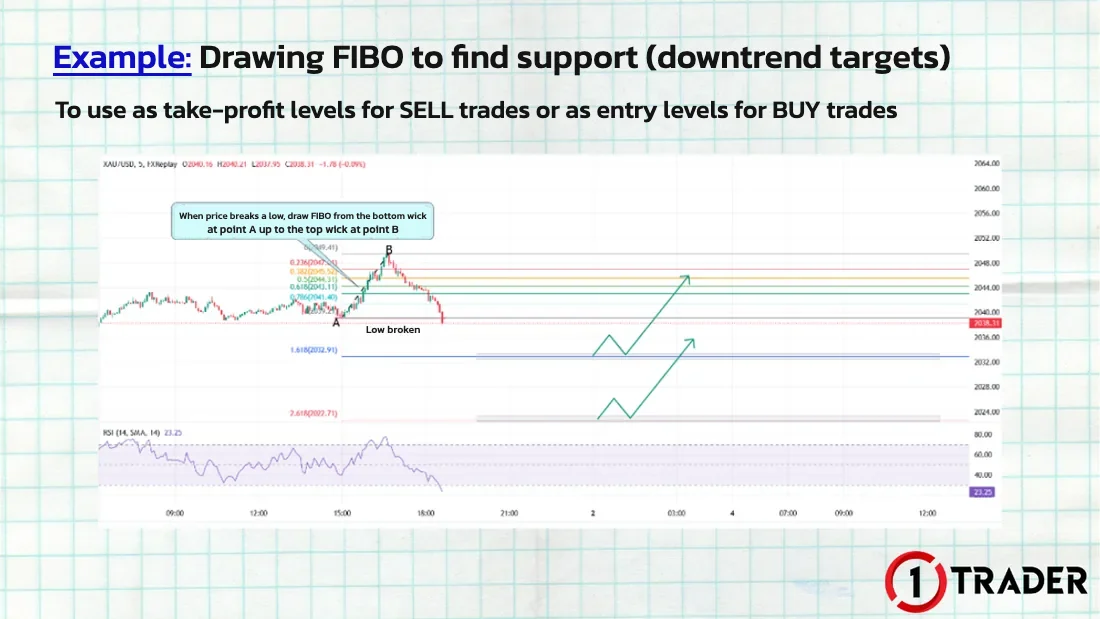
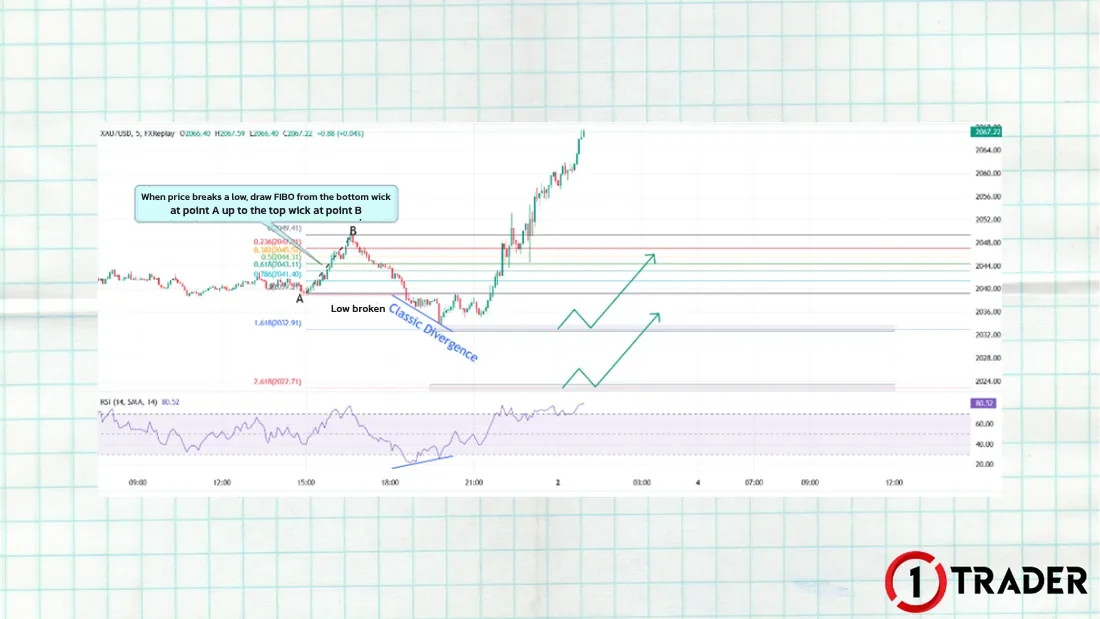
Which FIBO support levels are worth a counter-trend BUY?
For example, an M5 FIBO support level that also shows an M5 divergence signal and lines up with a demand zone or FVG on a higher timeframe such as H1. Then you can consider a counter-trend BUY, with the SL below the next nearest FIBO support (FIBO entries don’t need a wide SL, because they often get wick-tip prices).
Cautions when using FIBO
Summary: how to use FIBO (Fibonacci)
| Used for | Condition | How to draw | Levels | Use |
|---|---|---|---|---|
| Resistance (uptrend targets) | High broken | Top wick A → bottom wick B (uptrend head) | 1.618 · 2.618 · 3.618 · 4.236 | BUY TP / counter-trend SELL |
| Support (downtrend targets) | Low broken | Bottom wick A → top wick B (downtrend head) | 1.618 · 2.618 · 3.618 · 4.236 | SELL TP / counter-trend BUY |
| Counter-trend entry | M5 divergence + H1 zone | Supply/demand zone or FVG | SL beyond the next level | No need for a wide SL |
| Timeframe | TP: any timeframe | Entries: M5 | Wick-tip prices | Always check the trend |
The key to using FIBO: wait for price to break a high or a low, then draw on the trend head from wick to wick. Use the 1.618, 2.618, 3.618 and 4.236 levels as take-profit targets with the trend, and only take counter-trend entries at FIBO levels when they are confirmed by factors such as divergence and a higher-timeframe zone.
FAQ about FIBO
What is FIBO?
FIBO, or Fibonacci retracements, is a tool that measures chart ratios to project future support and resistance. FIBO levels can be used as take-profit points (TP) or as entries.
Where does FIBO come from?
It is named after Leonardo Pisano Fibonacci, a 13th-century Italian mathematician known for the sequence 0, 1, 1, 2, 3, 5, 8, 13, 21, 34, 55, 89, 144, where each number is the sum of the two before it. Ratios from this sequence are used to find key price levels in trading.
What are the key Fibonacci ratios?
Common retracement levels are 0.236, 0.382, 0.5, 0.618 (the golden ratio) and 0.786. Extension levels such as 1.272, 1.618, 2.618 and 4.236 are used to find targets when price runs beyond the previous swing.
How do you draw FIBO for resistance?
When price breaks a high, the previous down swing (AB) is the uptrend head. Drag FIBO from the top wick at point A down to the bottom wick at point B to get resistance at 1.618, 2.618, 3.618 and 4.236, used as BUY take-profit levels or SELL entries.
How do you draw FIBO for support?
When price breaks a low, the previous up swing (AB) is the downtrend head. Drag FIBO from the bottom wick at point A up to the top wick at point B to get support at 1.618, 2.618, 3.618 and 4.236, used as SELL take-profit levels or BUY entries.
What should you check before a counter-trend trade at a FIBO level?
An entry at a FIBO level is always counter-trend, so wait for the M5 FIBO level to show a divergence signal and line up with a supply zone, demand zone or FVG on a higher timeframe such as H1, then place your SL beyond the next nearest FIBO level.
Which timeframe should you use FIBO on?
FIBO works for TP targets on any timeframe, but for entries M5 is recommended because it gives sharp entries and the best chance of wick-tip prices, so you don’t need a wide SL.
Read EP7 again Next lesson · EP9 What Is Money Management? Managing Risk and Calculating Lot Size Pips / points · profit and loss formula · lot size from your risk
Read EP9 →
See all lessons in the free Forex and gold trading course
Risk warning: Trading Forex, gold and CFDs carries a high level of risk and you may lose money. 1TRADER provides information and education to support your own decisions only. The real chart examples use historical data and do not guarantee future results. Read the full risk disclosure.