
What Are Demand & Supply Zones?
How to Trade Them + Order Blocks
Demand & supply zones are areas where a lot of buying or selling built up, so price often moves sharply when it comes back to test them. Learn to draw the zones, tell the 4 types apart, find BUY/SELL entries, set your SL and use order blocks, with real gold chart examples.
Quick summary
- Demand & supply zones are support and resistance from areas where a lot of buying or selling built up · price entering a demand zone is likely to rise · entering a supply zone is likely to fall
- A sideways range (base) that is broken upward = demand zone (RBR, DBR) · broken downward = supply zone (DBD, RBD)
- In an uptrend, BUY when price comes down to test a demand zone, SL below the zone · in a downtrend, SELL when price rises to test a supply zone, SL above the zone
- A broken zone flips its role: demand broken down → supply · supply broken up → demand
- An order block uses a single candle before a strong break (body + wick) as support or resistance. See examples in section 05
Previous lessons: EP1 Trends and trendlines · EP2 Sideway trading · EP3 Trend reversals · EP4 Trendline + speed line
What are demand & supply zones?
Demand & supply zones are a type of support and resistance that comes from areas where a lot of buying or selling built up in the past. When price comes back to test one of these zones, it often makes a significant move.
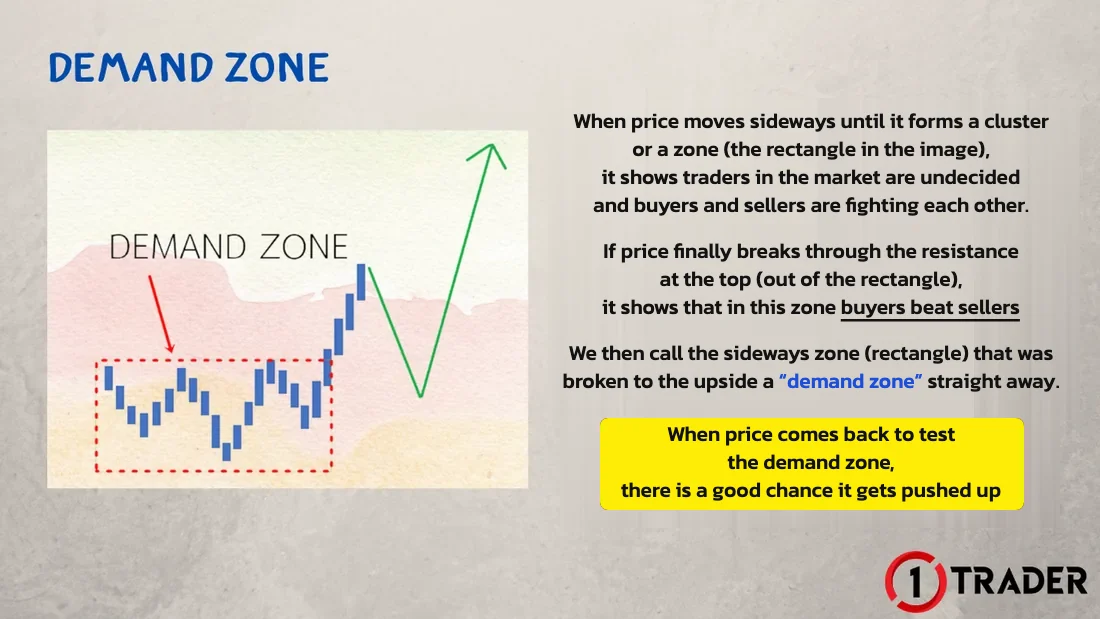
Sideways range broken upward = demand zone
When price moves sideways in a cluster, it shows hesitation and a fight between buyers and sellers. If price finally breaks out above the range = buyers win, and that sideways range becomes a demand zone straight away.
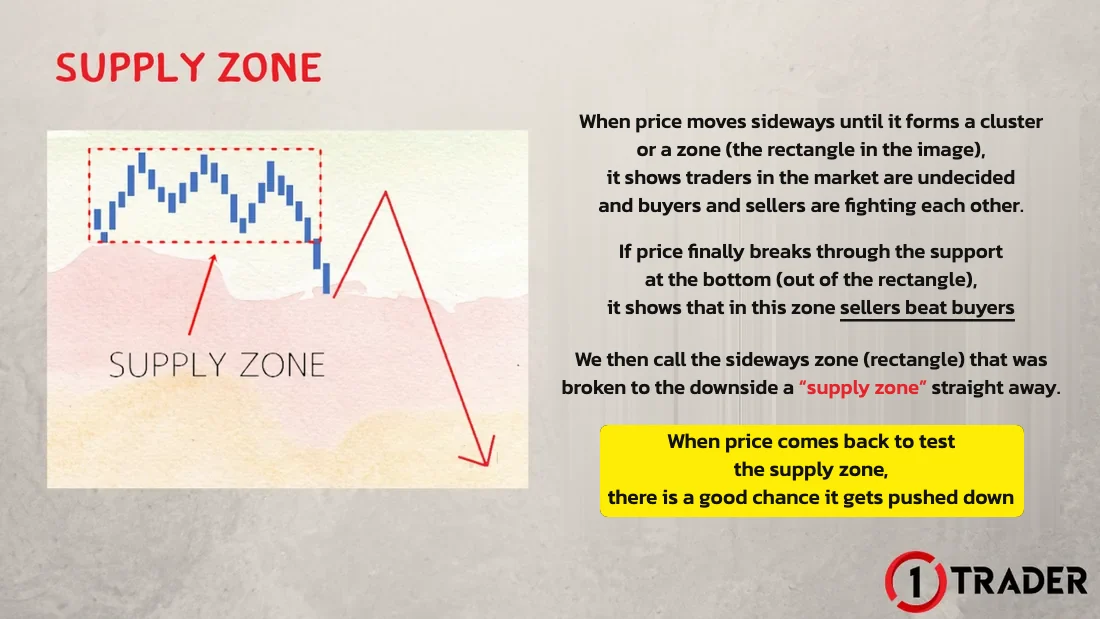
Sideways range broken downward = supply zone
If price breaks out below the sideways range = sellers win, and that range becomes a supply zone straight away. When price comes back up to test it, it is likely to be pushed down.
Some traders call demand and supply zones the footprints left by big players. Whether or not that is true, these zones are very useful for reading charts and finding entries with an edge · See how to draw a sideways range (base) in EP2 How to trade a sideway market
What a demand zone looks like and its types
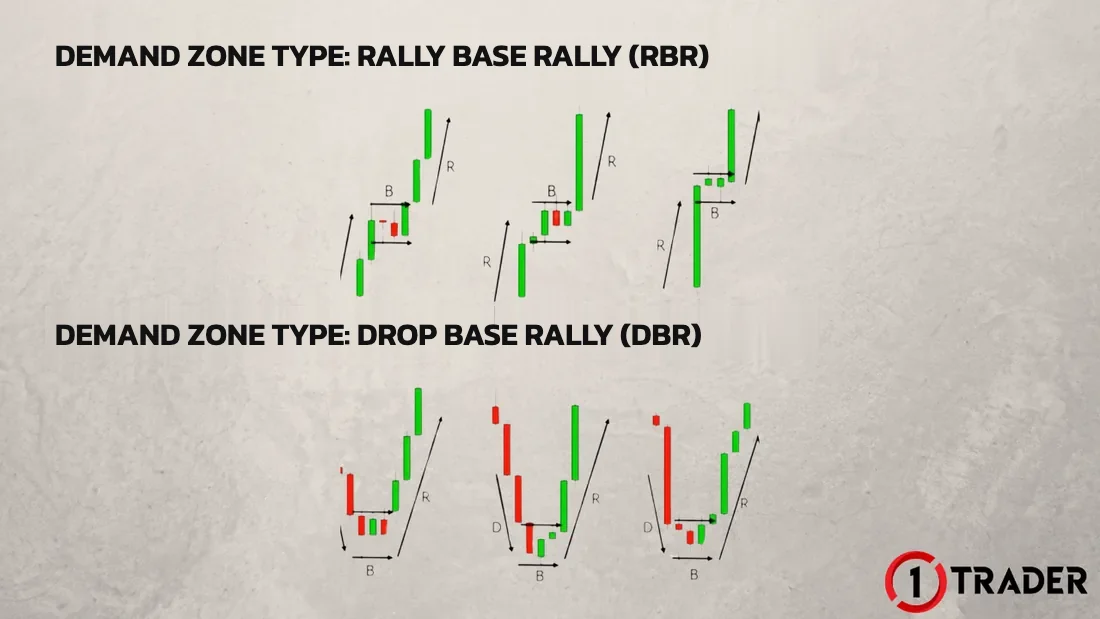
When price comes back to test a demand zone, there is a good chance it is pushed up. There are 2 types of demand zone:
Rally Base Rally (RBR)
Price rises first (rally), pauses to form a sideways range (base), then breaks out and keeps rising (rally) · the demand zone is the sideways range
Drop Base Rally (DBR)
Price falls first (drop), pauses to form a sideways range (base), then breaks out and rises (rally) · the demand zone is the sideways range
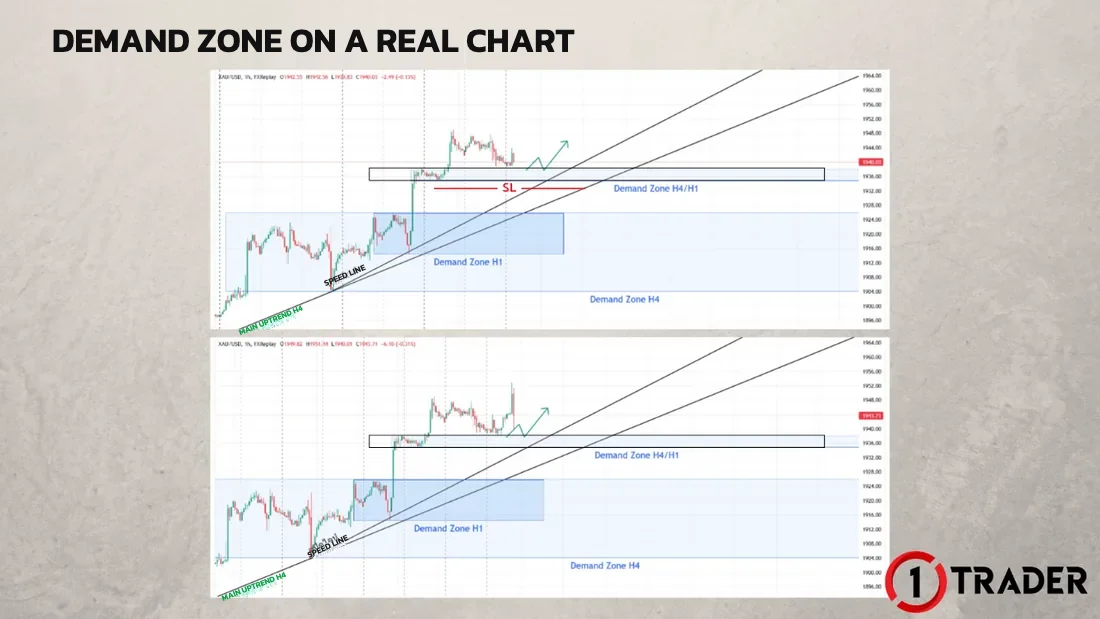
Using a demand zone on a real chart → BUY with the trend
The gold chart (XAUUSD) on H1 is in an uptrend, with an RBR demand zone below price (the black box in the top image). When price comes down to test the demand zone, whether at the edge, the middle or the far side of the zone, you can BUY with the trend straight away, with your SL below the demand zone you used for the entry.
In the bottom image, price quickly rose to a new high with the uptrend.
Before trading demand and supply zones, get comfortable reading the trend first, because trading with the trend improves your chances · Review how to read trends in EP1 What is a trend
What a supply zone looks like and its types
When price comes back to test a supply zone, there is a good chance it is pushed down. There are 2 types of supply zone:
Drop Base Drop (DBD)
Price falls first (drop), pauses to form a sideways range (base), then breaks out and keeps falling (drop) · the supply zone is the sideways range
Rally Base Drop (RBD)
Price rises first (rally), pauses to form a sideways range (base), then breaks out and falls (drop) · the supply zone is the sideways range
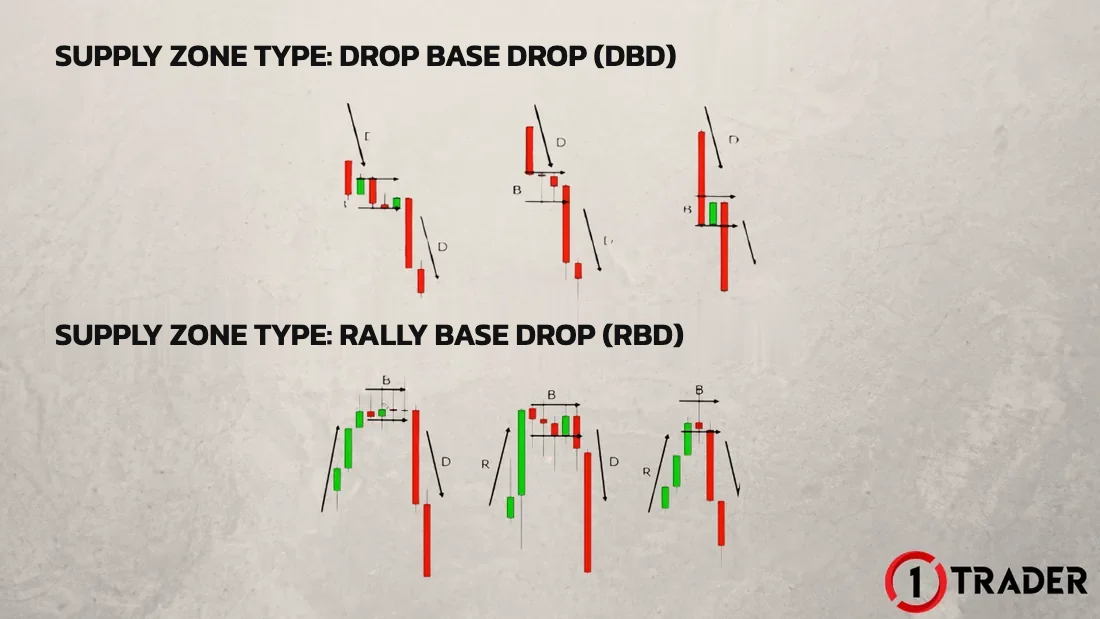
Using a supply zone on a real chart → SELL with the trend
The gold chart (XAUUSD) on H1 is in a downtrend, with an RBD supply zone just above price (the lowest purple box in the top image). When price rises to test the supply zone, whether at the edge, the middle or the far side of the zone, you can SELL with the trend straight away, with your SL above the supply zone you used for the entry.
In the bottom image, price quickly fell to a new low with the downtrend.
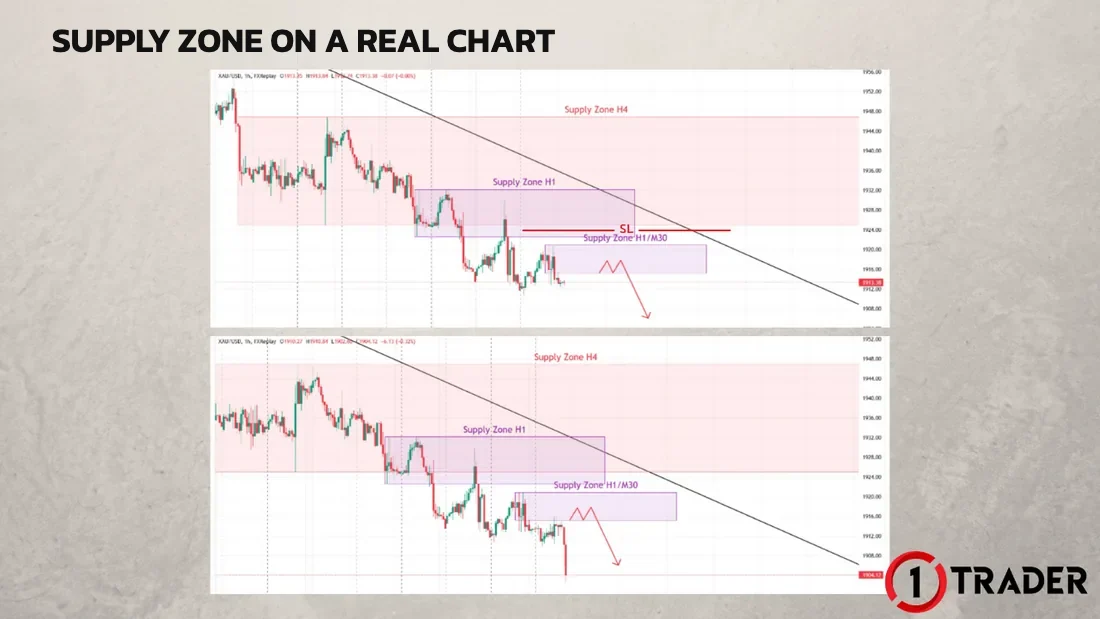
Never forget that trading demand and supply zones only works once you can read the trend · in an uptrend, focus on BUY at demand zones · in a downtrend, focus on SELL at supply zones
Demand & supply zone role reversal
Demand and supply zones can switch roles when price breaks through them.
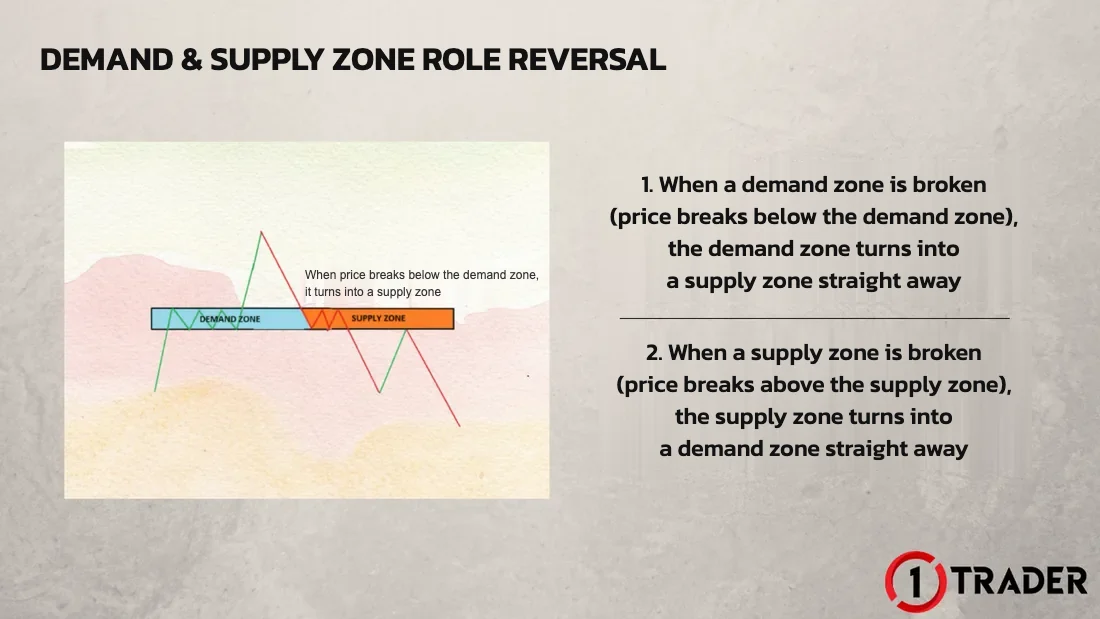
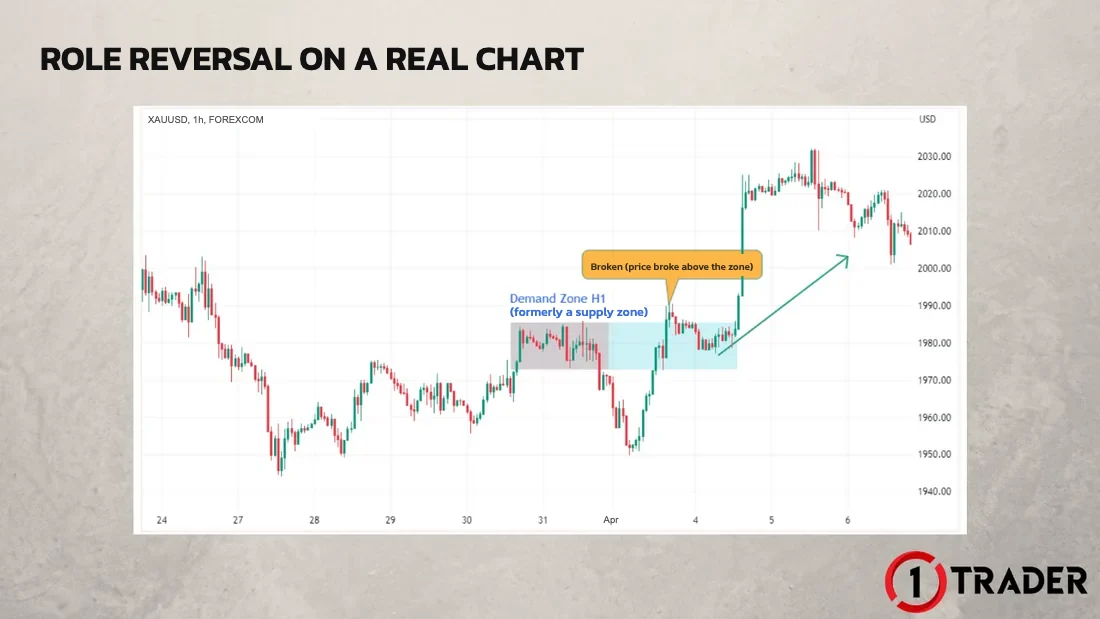
Role reversal on a real chart
On this H1 gold chart, a supply zone acting as resistance is broken to the upside, so the zone becomes a demand zone straight away. When price comes back down to test it, buyers are likely to push it higher.
What is an order block (OB)?
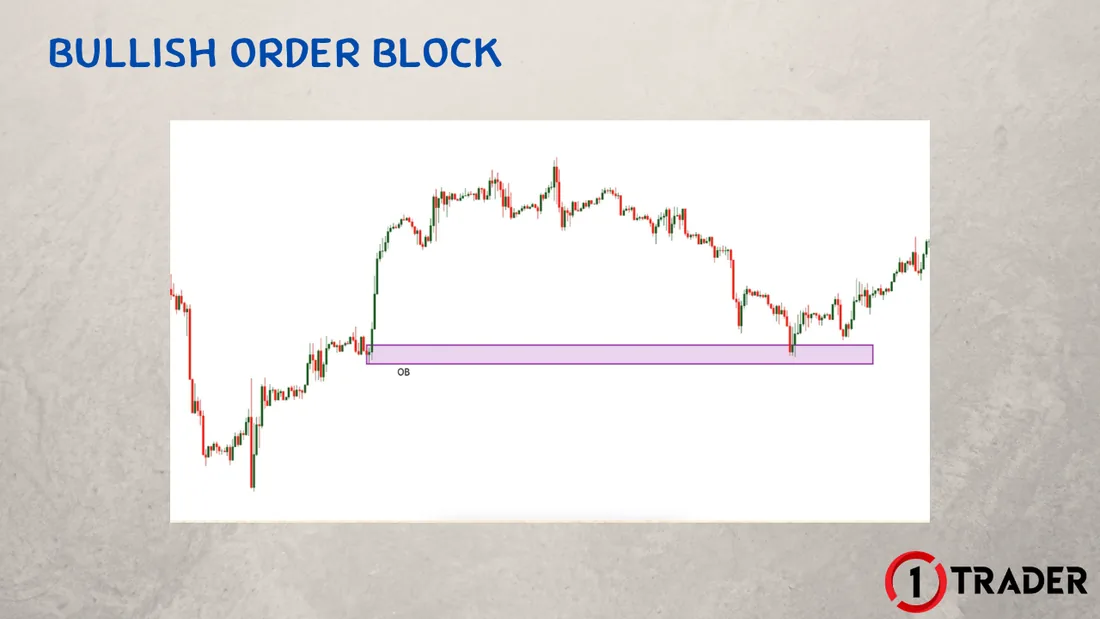
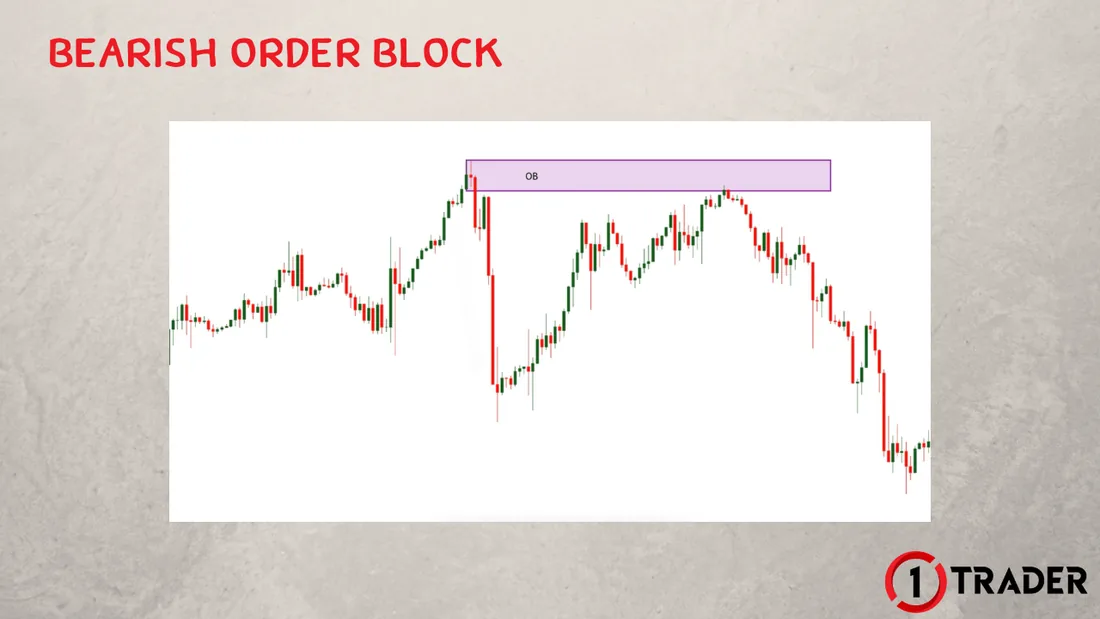
An order block (OB) is a type of support and resistance from an area where a lot of buying or selling built up in the past, just like a demand or supply zone, but it looks different.
Bullish order block = support
Bearish order block = resistance
Summary: trading demand & supply zones and order blocks
| Zone | Pattern | Entry | Trade | Stop Loss |
|---|---|---|---|---|
| Demand Zone · RBR | Rally → Base → Rally | Price comes down to test the zone (edge/middle/far side) | BUY | Below the demand zone |
| Demand Zone · DBR | Drop → Base → Rally | Price comes down to test the zone | BUY | Below the demand zone |
| Supply Zone · DBD | Drop → Base → Drop | Price rises to test the zone (edge/middle/far side) | SELL | Above the supply zone |
| Supply Zone · RBD | Rally → Base → Drop | Price rises to test the zone | SELL | Above the supply zone |
| Role reversal | Demand broken down / supply broken up | Use the zone in its new role | Per the new role | Demand → Supply · Supply → Demand |
| Bullish Order Block | Candle before a strong break up (body + wick) | Price comes back down to test | BUY | Below the OB zone |
| Bearish Order Block | Candle before a strong break down (body + wick) | Price comes back up to test | SELL | Above the OB zone |
The key to trading demand & supply zones: read the trend first, then pick zones on the same side as the trend (demand zones in an uptrend · supply zones in a downtrend), enter when price comes back to test the zone, and always place your SL outside the zone. Order blocks follow the same idea, but the zone is drawn from a single candle.
FAQ about demand & supply zones
What are demand & supply zones?
Demand & supply zones are a type of support and resistance from areas where a lot of buying or selling built up in the past. When price comes back to test a demand zone it is likely to rise, and when it tests a supply zone it is likely to fall.
How many types of demand zone are there?
There are 2: Rally Base Rally (RBR), where price rises, pauses sideways, then breaks up again, and Drop Base Rally (DBR), where price falls, pauses sideways, then breaks up. Both use the sideways range (base) as the demand zone.
How many types of supply zone are there?
There are 2: Drop Base Drop (DBD), where price falls, pauses sideways, then breaks down again, and Rally Base Drop (RBD), where price rises, pauses sideways, then breaks down. Both use the sideways range (base) as the supply zone.
Where should you place your stop loss when trading demand and supply zones?
For a BUY at a demand zone, place your SL below the zone. For a SELL at a supply zone, place your SL above the zone. Trade with the trend to improve your chances.
What is demand & supply zone role reversal?
When price breaks below a demand zone, that zone turns into a supply zone straight away. When price breaks above a supply zone, that zone turns into a demand zone straight away.
How is an order block different from a demand or supply zone?
An order block is also support or resistance from an area where buying or selling built up, but it is drawn from a single candle just before a strong break (covering both the body and the wick), while a demand or supply zone uses the whole sideways range.
Read EP4 again Next lesson · EP6 What Is a Fair Value Gap (FVG)? How to Mark It and Find Entries Bullish / bearish FVG · BUY/SELL entries · free FVG indicator
Read EP6 →
See all lessons in the free Forex and gold trading course
Risk warning: Trading Forex, gold and CFDs carries a high level of risk and you may lose money. 1TRADER provides information and education to support your own decisions only. The real chart examples use historical data and do not guarantee future results. Read the full risk disclosure.