
How to Spot a Trend Reversal:
2 Steps to Read a Trend Change
Spotting a trend reversal is not hard. Understand the trend rules, draw a trendline along the trend, then wait for a trendline break followed by a new trend structure, with step-by-step examples and real gold charts.
Review the trend rules before looking for a reversal
When does a chart reverse? Many traders ask this. Spotting a reversal or trend change is actually not hard, but you first need to know how to read trends and understand the rules of each trend precisely. Only then can you spot reversals correctly.
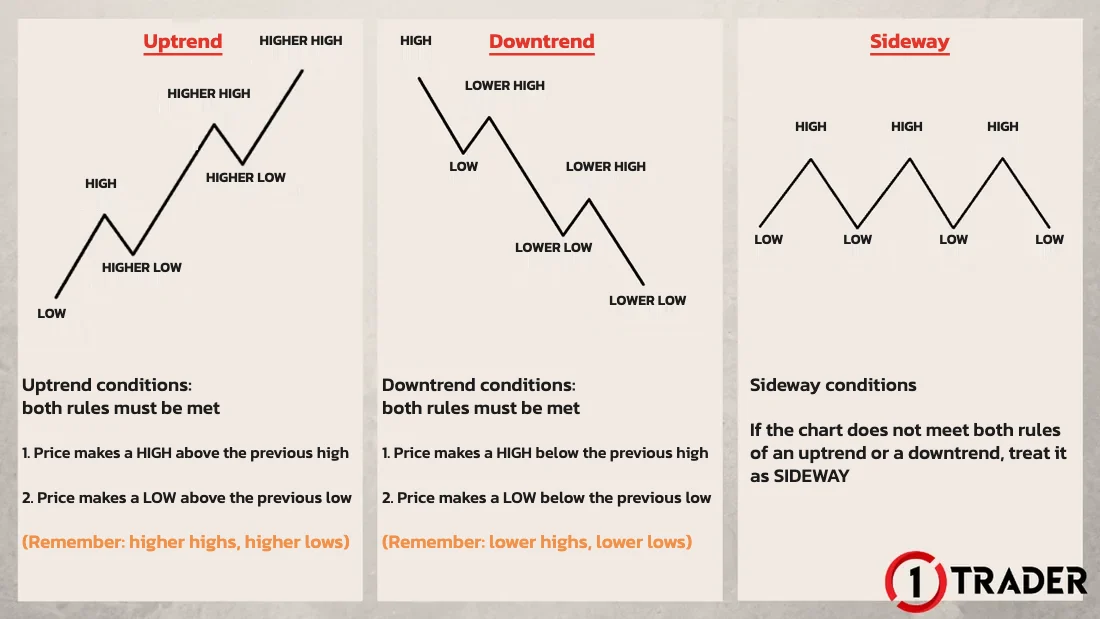
Uptrend rules
Downtrend rules
Sideway rule: if the chart does not meet “both rules” of an uptrend or a downtrend, treat it as sideway · Read more about trend basics in EP1 Trends and trendlines
2 steps to spot a trend reversal
There are only 2 steps to spot a trend reversal:
There are only 2 steps, but they take a lot of skill in reading trend structure. So the next section walks through a reversal slowly, step by step.
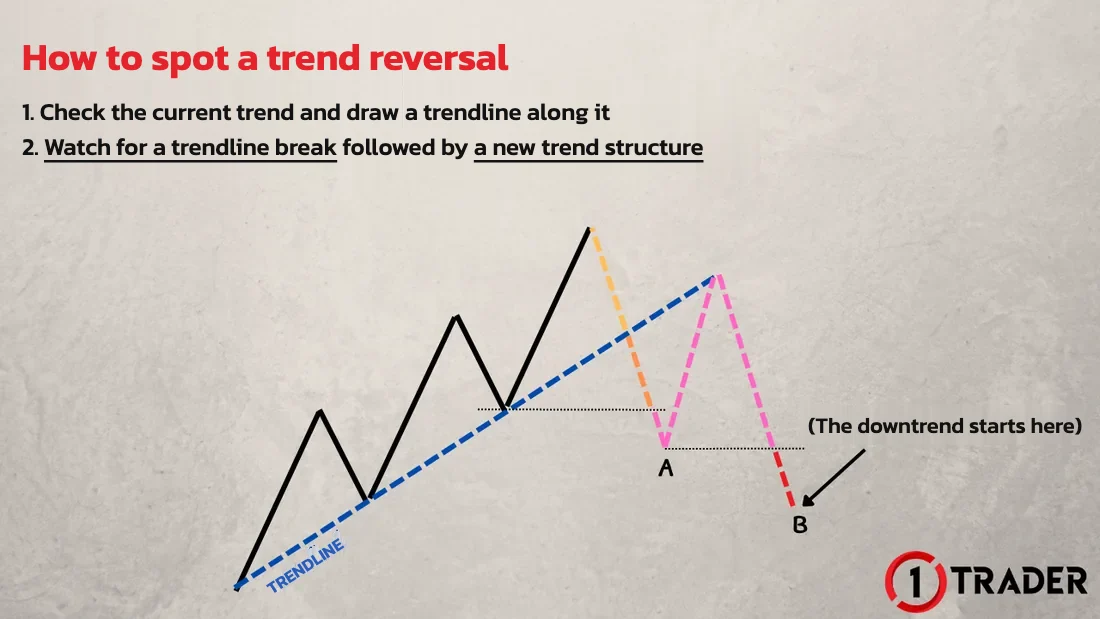
A reversal from uptrend to sideway and downtrend
Let’s look at a trend change from uptrend to downtrend, step by step. Note the dashed line colours in the images: orange = trendline break, pink = break of the low into sideway, red = complete downtrend structure.
Draw a trendline along the uptrend
When you find an uptrend (price makes higher highs and higher lows), draw a trendline along that uptrend.
As long as price stays above the trendline, the uptrend is still strong and you can keep looking for BUY entries with the trend.
Status: strong uptrend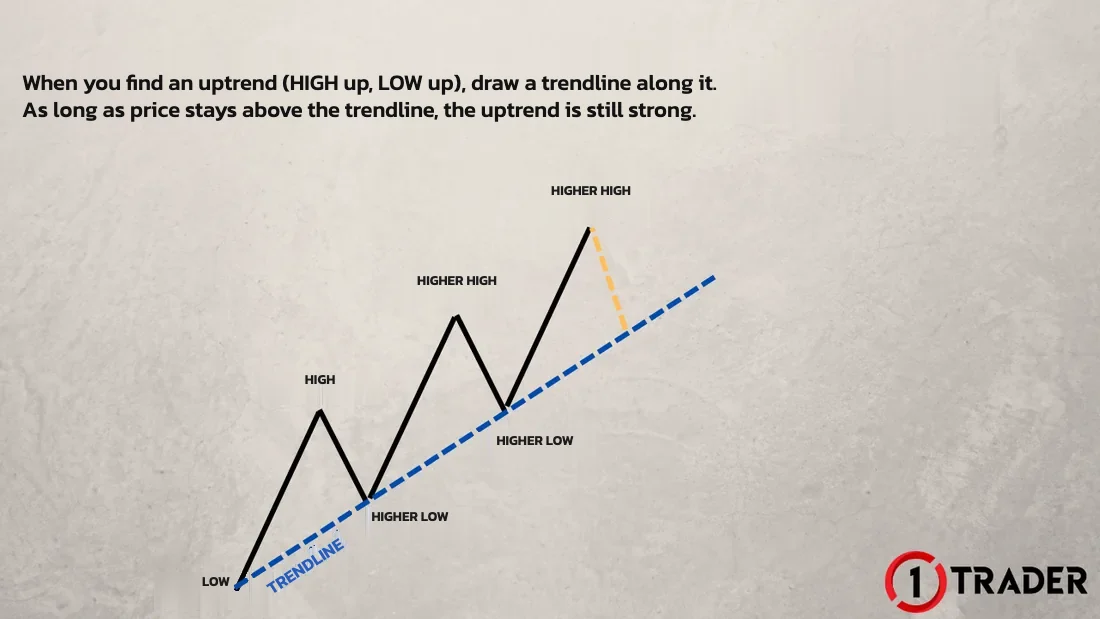
Trendline break = the trend is weakening
If price breaks below the trendline (orange dashed line), the trend is starting to weaken, so watch for a trend change.
But it is still an uptrend, because price has not broken the “higher low” on the left.
Status: still an uptrend, but weakening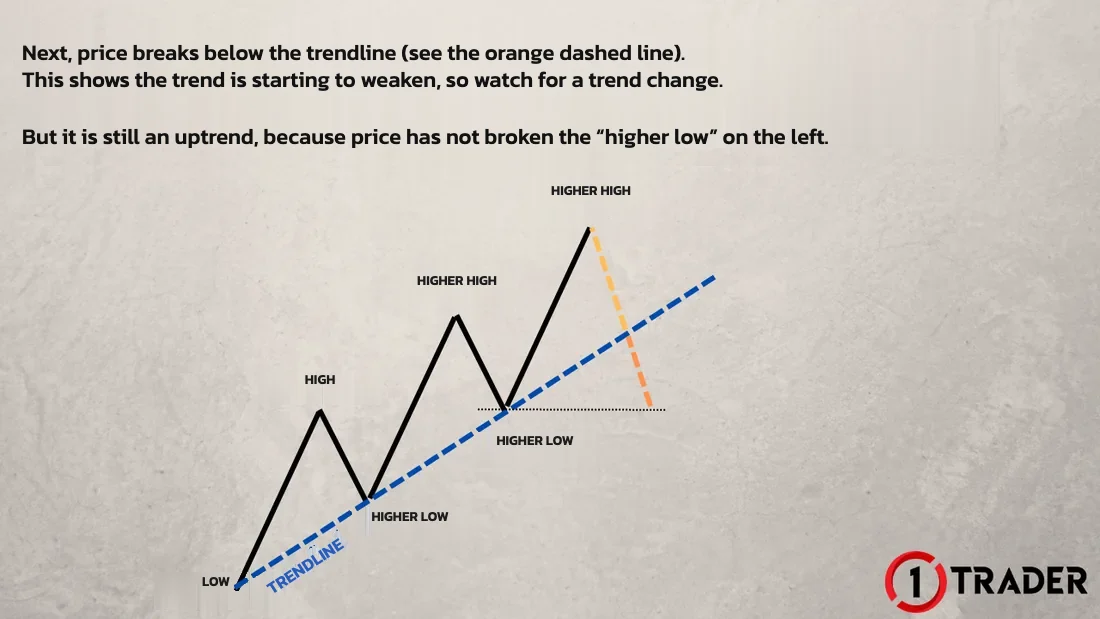
Higher low broken = sideway
If price breaks the “higher low” on the left (pink dashed line), the uptrend is broken, because the uptrend rules are no longer both met.
So price around the pink dashed line (point A) has moved into sideway straight away.
Status: sideway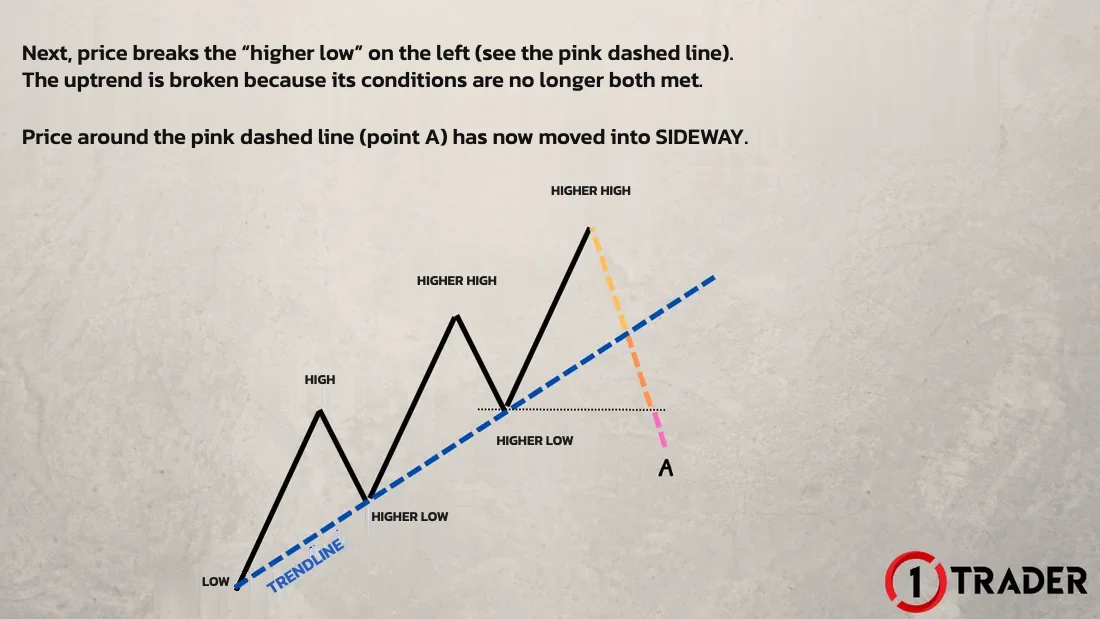
Lower highs, lower lows = reversal to a downtrend
If price forms a downtrend structure (red dashed line), breaking the previous low (point A) down to point B so that both downtrend rules are met: a lower high and a lower low,
then the chart has reversed into a downtrend.
Status: reversed to a downtrend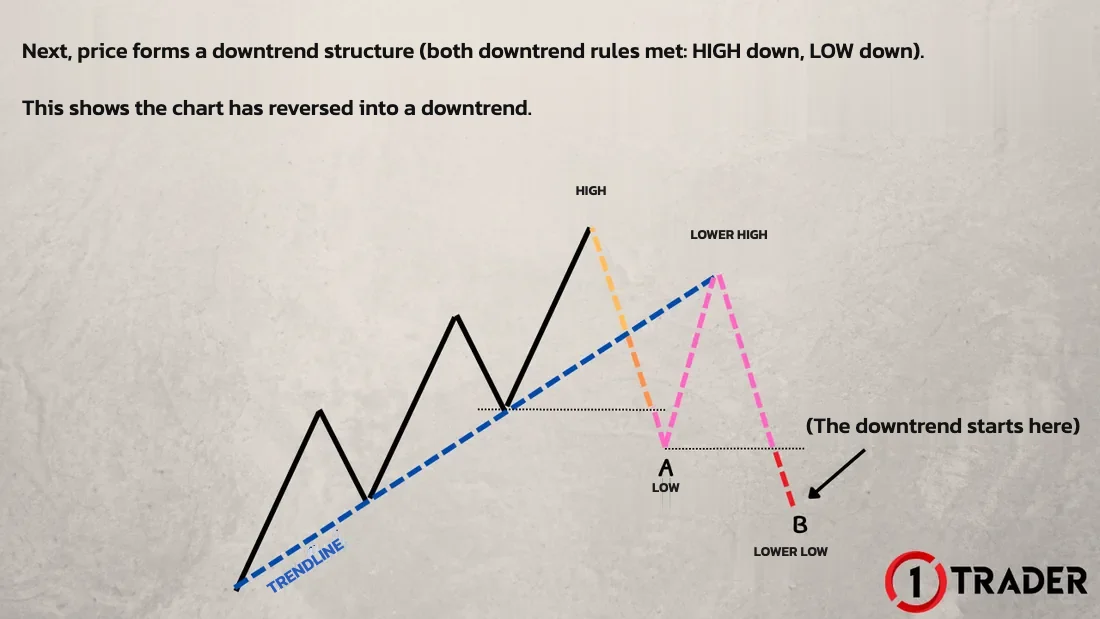
A reversal from downtrend to uptrend on a real gold chart
The same rules apply to a reversal from downtrend to uptrend. This example uses the gold chart (XAUUSD) on the 4-hour timeframe.
1) Downtrend line broken, but the LH holds
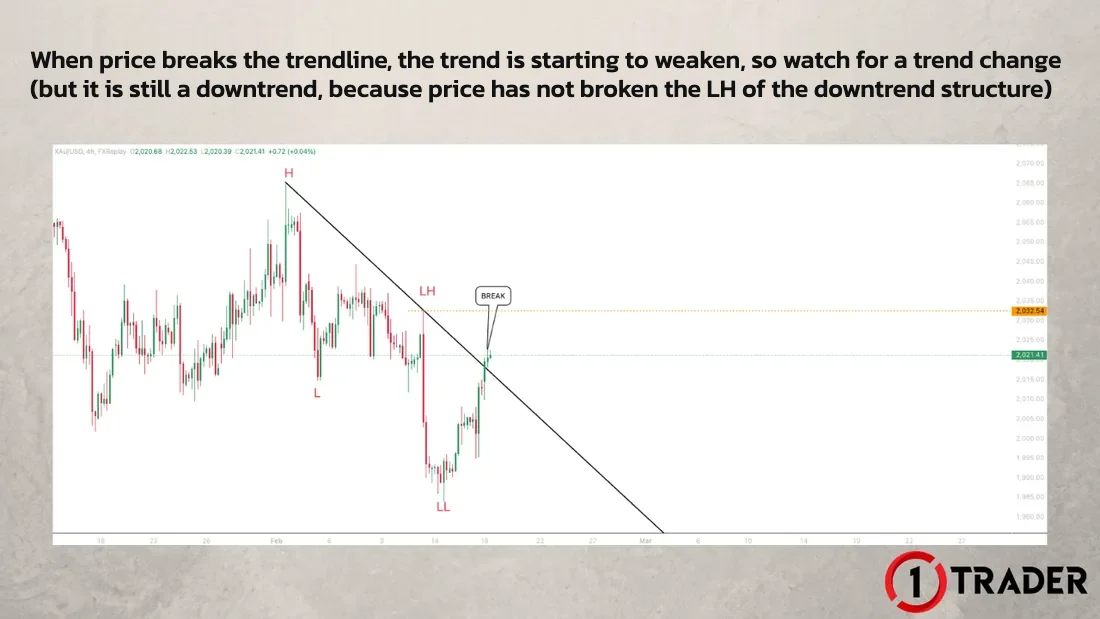
Price is in a downtrend with a trendline drawn along it. When price breaks above the trendline, the downtrend is starting to weaken, so watch for a trend change. But it is still a downtrend, because price has not broken the LH (Lower High) that is part of the downtrend structure.
2) LH broken, then an uptrend structure = confirmed reversal
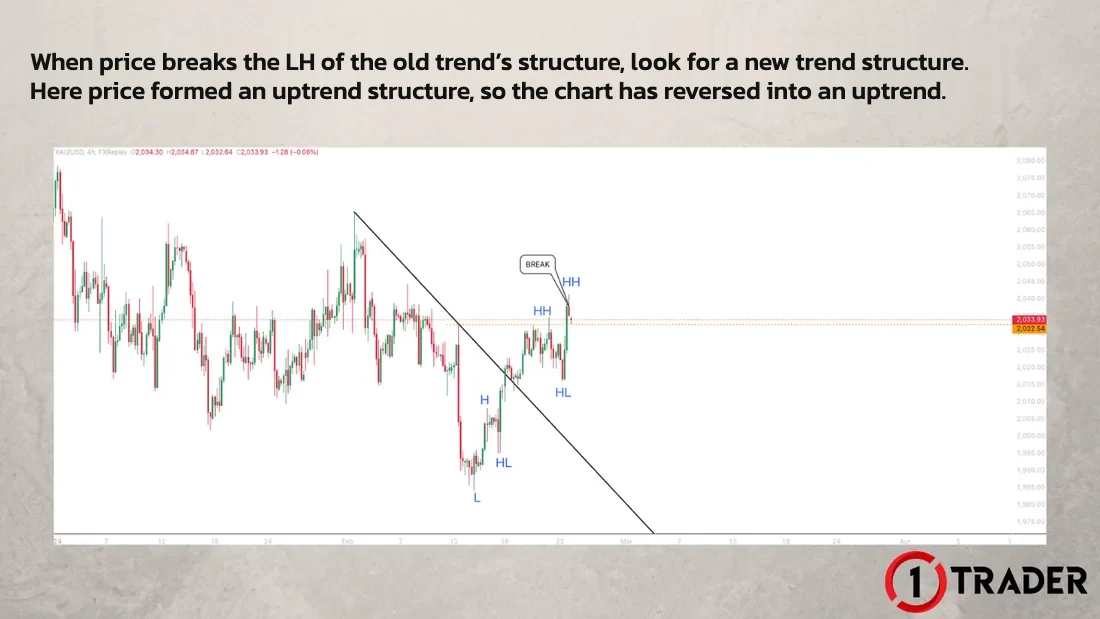
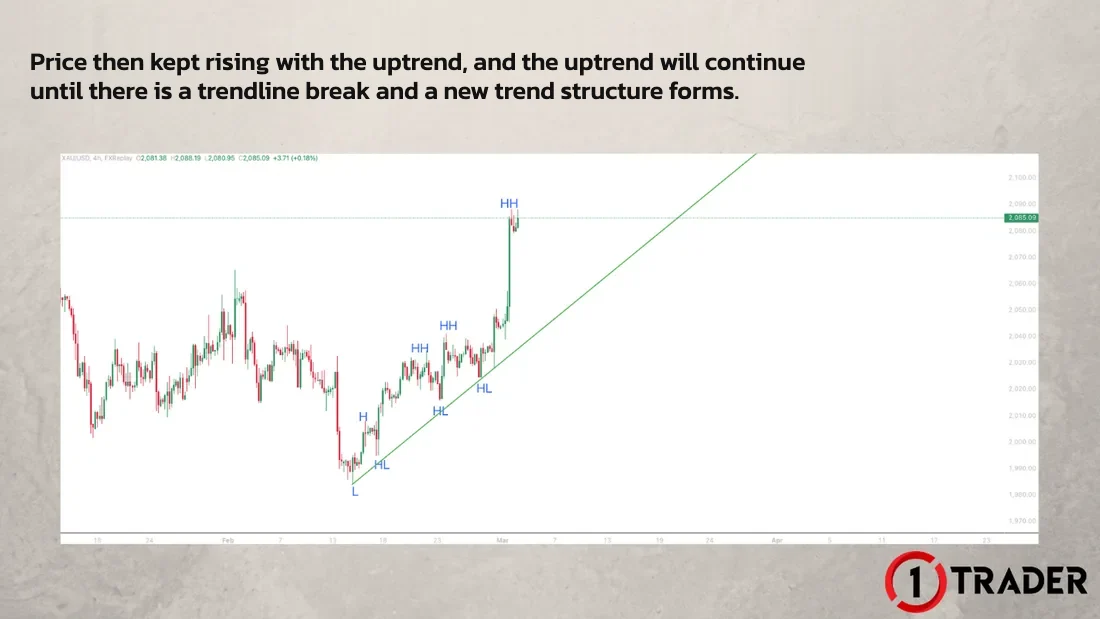
When price breaks the LH (lower high) of the old downtrend structure, look for a new trend structure straight away. In this example price formed an uptrend structure, making higher highs and higher lows (HH, HL), so the chart has reversed into an uptrend.
3) The uptrend continues until the next reversal
Price then kept rising with the uptrend, and the uptrend will continue until there is a trendline break and a new trend structure. In other words, you go back to the same 2 steps again.
Be careful when reading reversals: a reversal on a smaller timeframe does not mean the larger timeframe reverses too. Always check the trend on each timeframe before you trade.
Summary: how to spot a trend reversal
| Step | What price does | Trend status | What to do |
|---|---|---|---|
| 1 | Stays above the uptrend line (higher highs, higher lows) | Strong uptrend | Keep looking for BUY entries with the trend |
| 2 | Breaks below the trendline, but the higher low holds | Weakening uptrend | Watch for a trend change |
| 3 | Breaks the higher low on the left (point A) | Sideway | Wait for a new trend structure |
| 4 | Makes a lower high and breaks the previous low (point B) | Reversed to a downtrend | The trend change is confirmed |
A downtrend works the same way in reverse: a break above the downtrend line = weakening → LH broken = the downtrend structure is broken → HH and HL = the chart has reversed into an uptrend. The key to reading a trend change is that a trendline break is only a warning. Wait for a new trend structure before treating it as a real reversal.
FAQ about trend reversals
How do you spot a trend reversal?
In 2 steps: 1) check which trend the chart is in and draw a trendline along it, 2) watch for a trendline break followed by a new trend structure.
Is a trendline break a reversal?
Not yet. A trendline break shows the trend is weakening, so start watching for a trend change. As long as price has not broken the higher low (in an uptrend) or the LH (in a downtrend), it is still in the same trend.
When does an uptrend turn into a sideway?
When price breaks the “higher low” on the left. The uptrend rules are then no longer both met, so the chart moves into sideway straight away.
How do you confirm a reversal to a downtrend?
Price must complete both downtrend rules: make a high below the previous high (lower high) and break the previous low to make a lower low.
When does a downtrend reverse into an uptrend?
When price breaks above the downtrend line, then breaks the LH (lower high) of the old downtrend structure, and then makes higher highs and higher lows (HH, HL). Only then has it reversed into an uptrend.
If a small timeframe reverses, does the larger timeframe reverse too?
Not necessarily. A reversal on a smaller timeframe does not mean the larger timeframe reverses too, so always check the trend on each timeframe before you trade.
What do HH, HL, LH and LL stand for?
HH is Higher High and HL is Higher Low, used to read an uptrend structure. LH is Lower High and LL is Lower Low, used to read a downtrend structure.
When should you enter after a reversal?
Wait for price to complete the new trend structure first, then look for entries with the new trend. For example, draw the new trendline, enter near the line and place your stop loss on the other side, as in EP1. Do not trade against the old trend just because price broke the trendline.
Read EP2 again Next lesson · EP4 What Is a Trendline? How to Use It with a Speed Line Main trendline + speed line (sub-trendline) to follow the trend and catch breakouts
Read EP4 →
See all lessons in the free Forex and gold trading course
Risk warning: Trading Forex, gold and CFDs carries a high level of risk and you may lose money. 1TRADER provides information and education to support your own decisions only. The real chart examples use historical data and do not guarantee future results. Read the full risk disclosure.