
What Is a Trendline?
Use It with a Speed Line
The trendline is a free tool that is often overlooked, yet it helps you find entries to ride the trend, breakout entries and cut-loss points. Learn to draw a main trendline + speed line, with real gold chart examples.
What is a trendline?
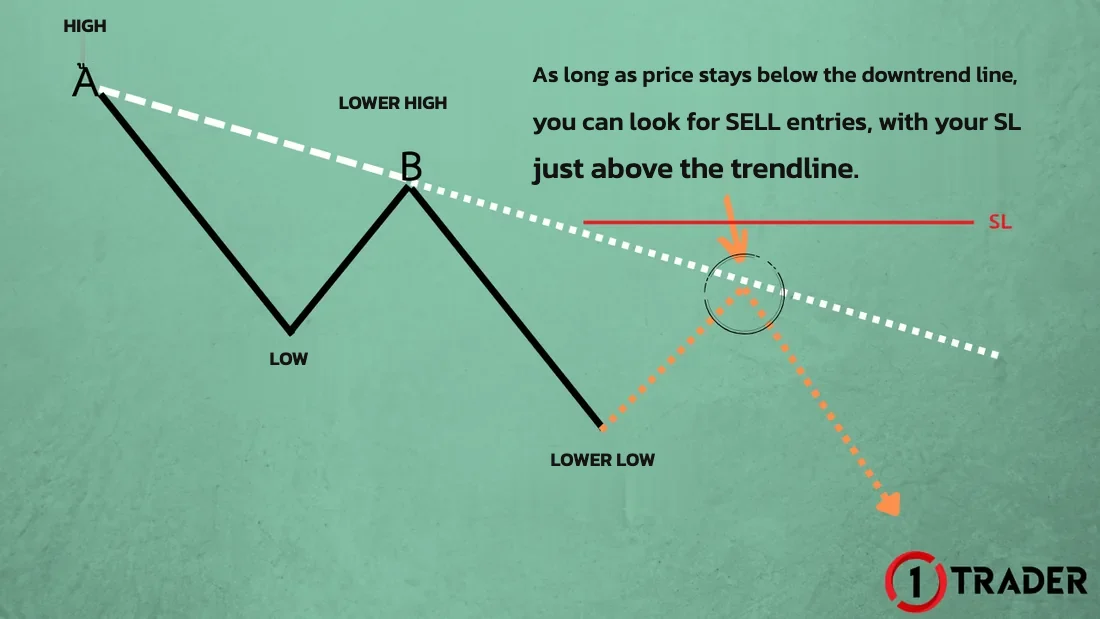
A trendline is a basic tool for reading support and resistance. It is a straight line that shows the direction of price in each phase of the trend.
How to draw a downtrend line
How to draw an uptrend line
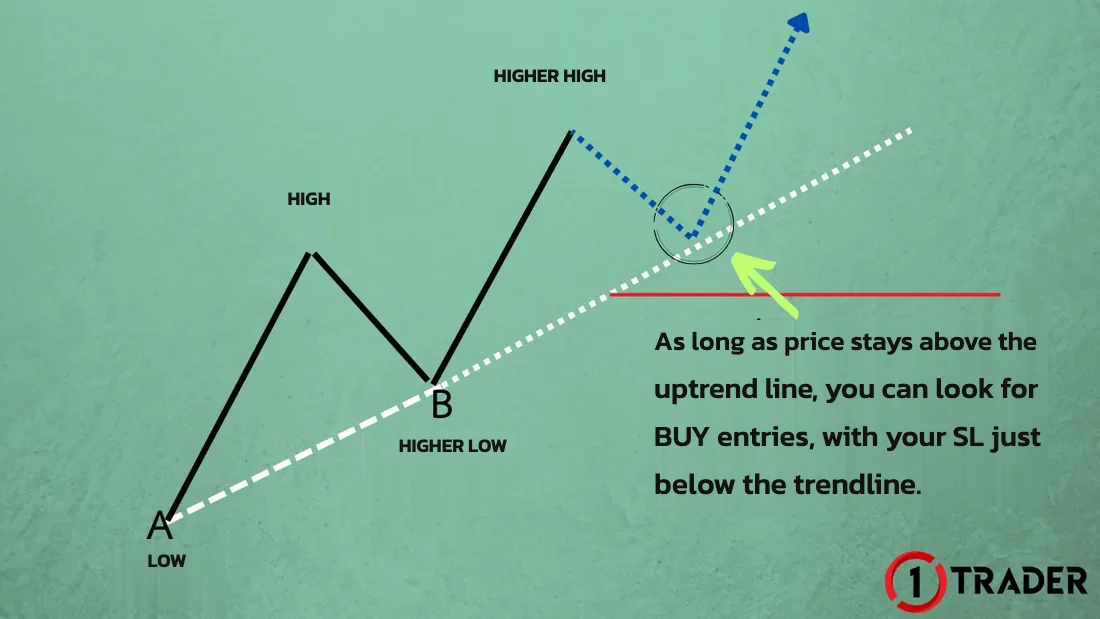
The trendline comes free on every trading platform, so it is often overlooked, even though it makes trading much easier: finding entries to ride the trend, timing breakouts and setting cut-loss points · Review the basics in EP1 Trends and trendlines and EP3 How to spot a trend reversal
What is a speed line or sub-trendline?
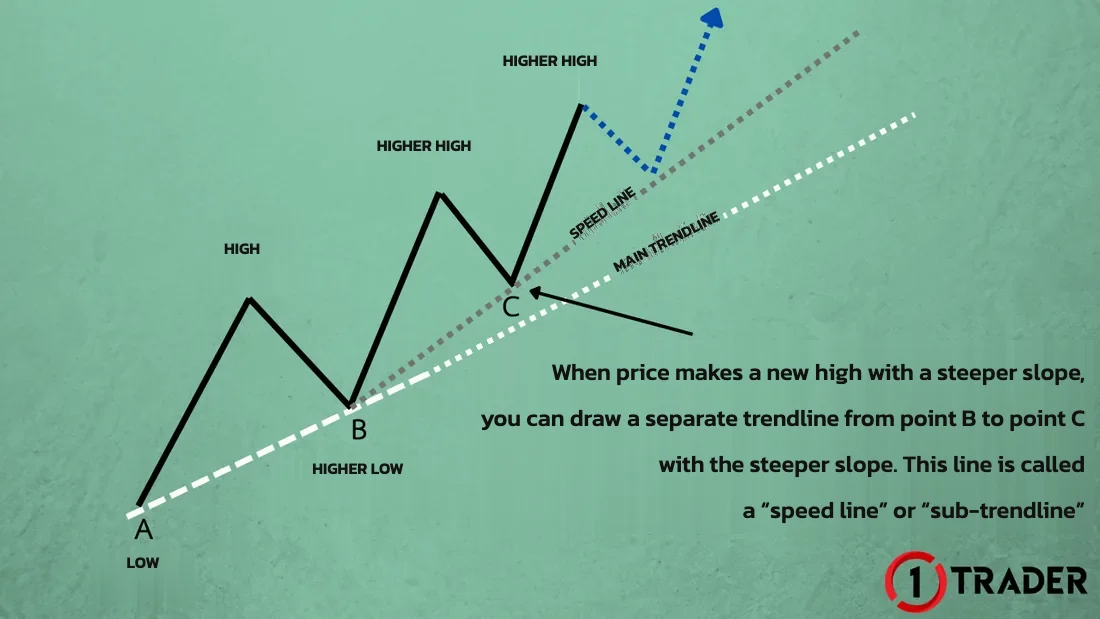
When price makes a new high with a steeper slope, you can draw a separate trendline from point B to the steeper point C. This line is called a “speed line” or “sub-trendline”.
A speed line is a support and resistance line that works exactly like a trendline. The difference is that it is steeper and always branches off the main trendline.
You can keep adding speed lines
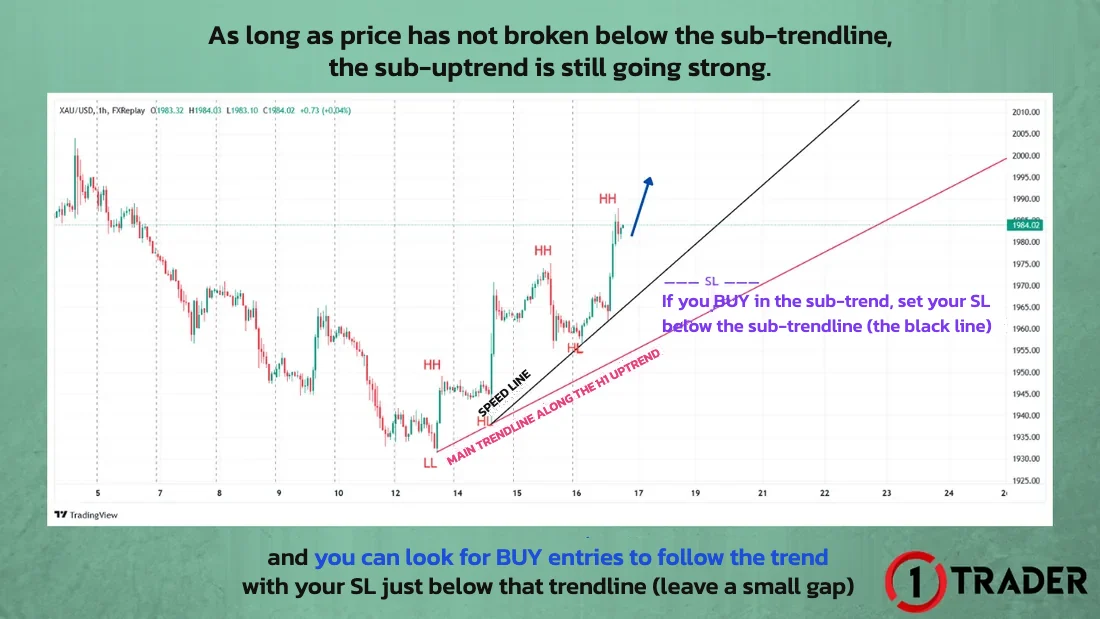
If price makes a new high or low with a steeper slope, you can keep adding speed lines or sub-trendlines with no limit. As long as price has not broken below the sub-trendline, the uptrend is still going strong.
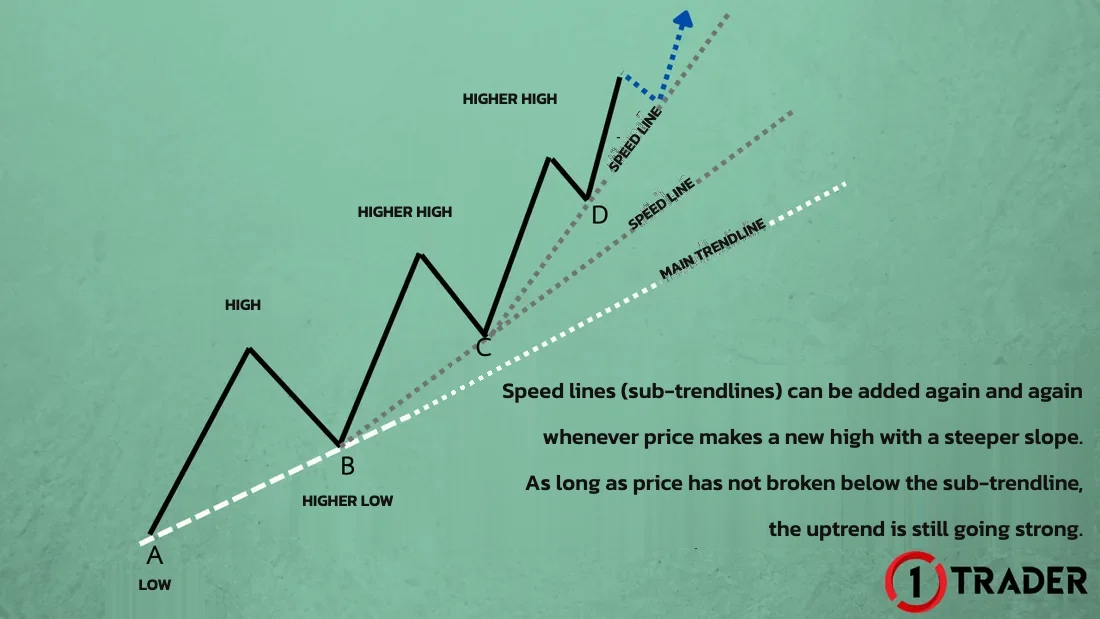
If price has not broken below even one sub-trendline, the edge is only on the BUY side, with the trend, and you should never SELL against it.
Using a main trendline with a sub-trendline on a real chart
This example is the gold chart (XAUUSD) on the H1 timeframe in an uptrend, making higher highs and higher lows. Note the line colours in the images:
1) Draw the main trendline + sub-trendline, then BUY with the trend
Draw a trendline along the uptrend from the lowest low at the start of the trend (using the wick) to the higher low. This gives the red line, which we call the main trendline. Price then makes a steeper new high, so we can draw another speed line (the black line), which we call the sub-trendline.
As long as price has not broken below the sub-trendline, the sub-uptrend is still strong and you can look for BUY entries to follow the trend, with your SL below that trendline (leave a small gap).
2) Sub-trendline broken = buying is weakening
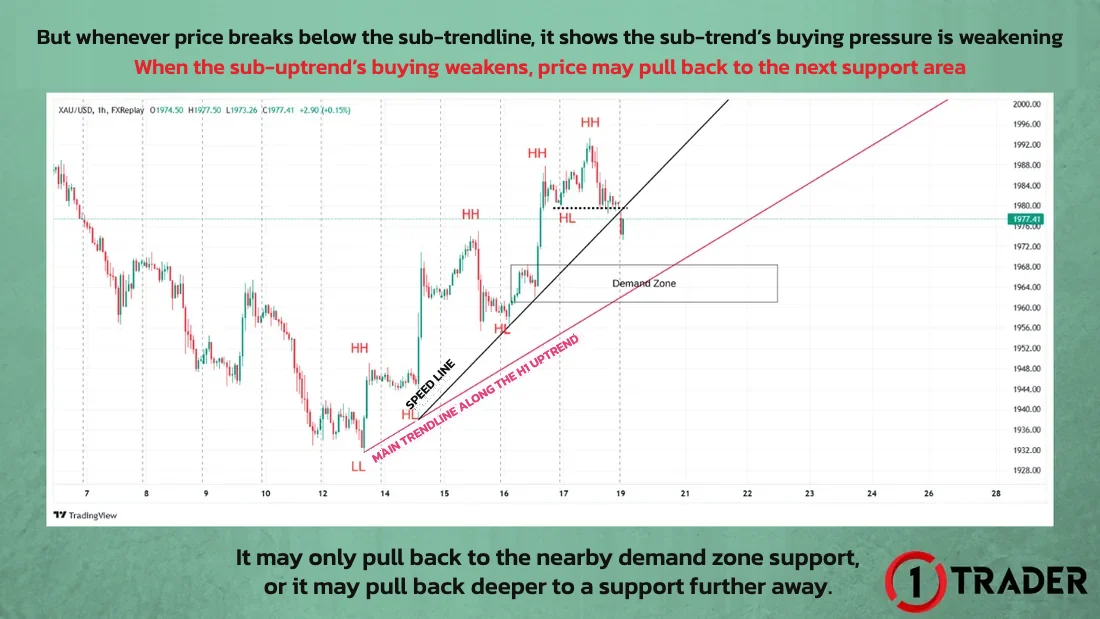
Whenever price breaks below the sub-trendline, the buying pressure of the sub-trend is weakening, so price may pull back to the next support. In the image, that is the demand zone and the support from the red main trendline.
Price may only pull back to a nearby support such as the demand zone, or it may pull back deeper to a support further away.
3) Pullback to the main trendline and a sub-downtrend
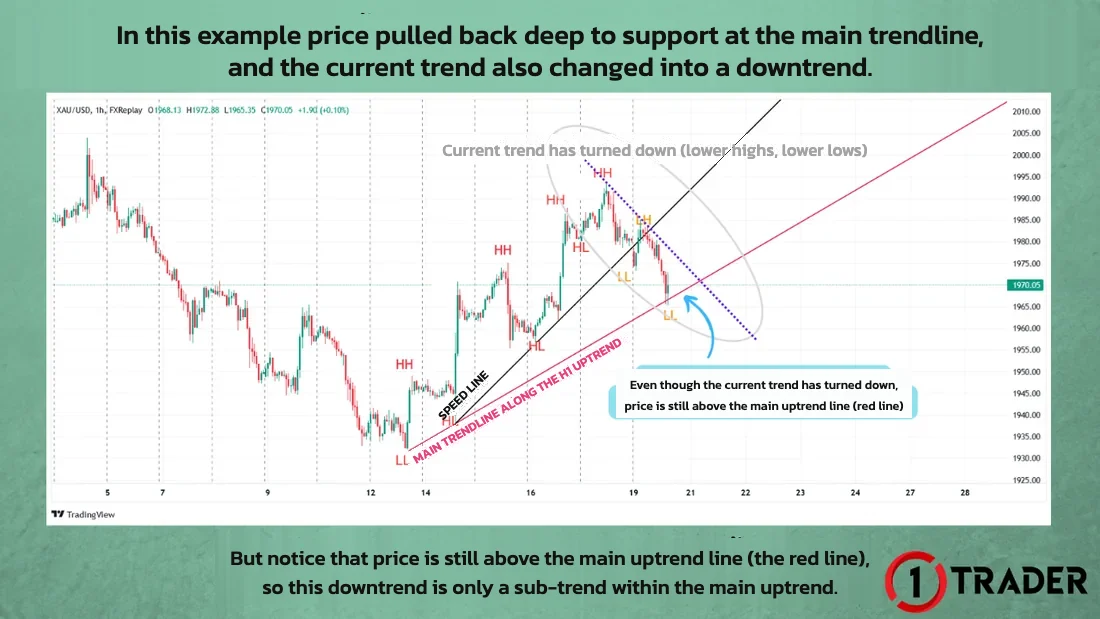
Price then pulled back to the support from the red main trendline, and the current trend turned down (inside the ellipse, price makes lower highs and lower lows). But price is still above the main uptrend line, so this downtrend is only a sub-trend within the main uptrend.
4) Break above the sub-downtrend line = BUY the breakout with the main trend
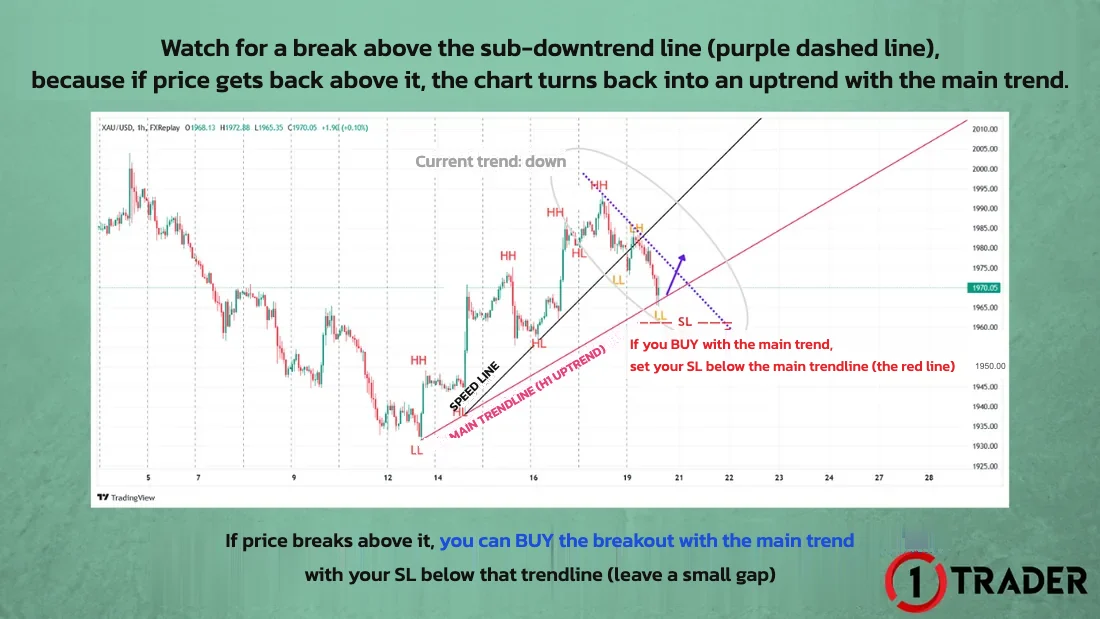
When a sub-downtrend runs above the main uptrend line like this, watch for a break above the sub-downtrend line (purple dashed line), because if price gets back above it, the chart turns back into an uptrend with the main trend.
If price breaks above it, you can open a BUY to catch the breakout with the main trend, with your SL below that trendline (leave a small gap) and a profit target at a new high.
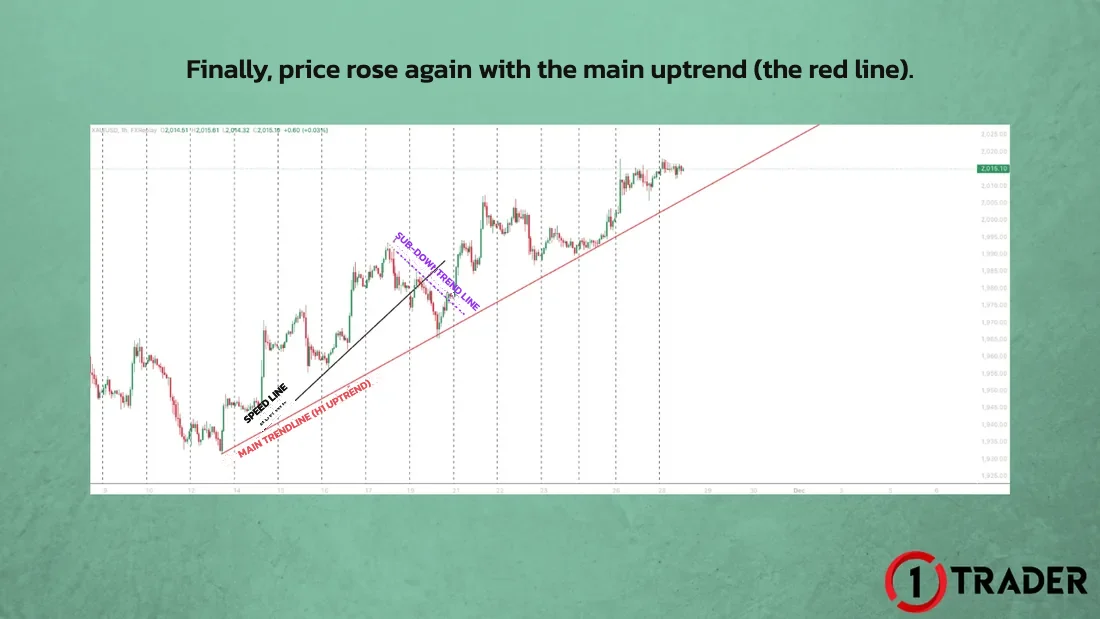
5) Price goes back to following the main uptrend
Finally, price rose again with the main uptrend (the red line), so the breakout BUY from step 4 reached its target at a new high.
Summary: how to use trendlines and speed lines
| Line | How to draw | Situation | Trade | Stop Loss |
|---|---|---|---|---|
| Downtrend line | Highest high → lower high | Price is below the line | SELL | Just above the line |
| Uptrend line | Lowest low (wick) → higher low | Price is above the line | BUY | Just below the line |
| Speed line (sub-trendline) | Off the main line to a steeper point | Sub-trendline not broken | BUY (follow the trend) | Just below the sub-trendline |
| Speed line broken | — | Buying is weakening | Do not SELL against it | Wait for the pullback to the next support |
| Sub-downtrend line | A downtrend above the main uptrend line | Price breaks above the line | BUY (breakout) | Just below the line · TP at a new high |
The key to using trendlines with speed lines: use the main trendline for the big direction, use the sub-trendline to time entries that follow the trend, and when a sub-downtrend stays above the main line, wait for a breakout back in the direction of the main trend, always with your SL below the line.
FAQ about trendlines and speed lines
What is a trendline?
A trendline is a basic tool for reading support and resistance. It is a straight line through 2 points that shows the direction of price in each phase of the trend.
How do you draw uptrend and downtrend lines?
An uptrend line is drawn from the lowest low to the higher low. A downtrend line is drawn from the highest high to the lower high.
What is a speed line?
A speed line or sub-trendline is a support and resistance line that works exactly like a trendline, but it is steeper and always branches off the main trendline. You can keep adding them as price makes new, steeper points.
How do you use a trendline to set your stop loss?
For a BUY in an uptrend, place your SL just below the trendline. For a SELL in a downtrend, place your SL just above the trendline.
What does it mean when price breaks below the sub-trendline?
It shows the buying pressure of the sub-uptrend is weakening. Price may pull back to the next support, such as a demand zone or the support from the main trendline.
When should you BUY a breakout with the main trend?
When a sub-downtrend is still running above the main uptrend line and price breaks above the sub-downtrend line, you can BUY with the main trend, with your SL below that trendline and a profit target at a new high.
Should you draw trendlines on the wicks or the candle bodies?
In this lesson the main trendline is drawn from the lowest low at the start of the trend using the tip of the wick, then to the higher low. The key is to use the same method every time so your support and resistance lines are consistent.
Should you SELL when a speed line breaks?
No. A speed line break only tells you the sub-trend’s buying is weakening, and price may just pull back to the next support. As long as price is above the main uptrend line, wait for a BUY with the main trend instead.
Read EP3 again Next lesson · EP5 What Are Demand & Supply Zones? How to Trade Them + Order Blocks Draw RBR, DBR, DBD and RBD zones · BUY/SELL entries · zone role reversal
Read EP5 →
See all lessons in the free Forex and gold trading course
Risk warning: Trading Forex, gold and CFDs carries a high level of risk and you may lose money. 1TRADER provides information and education to support your own decisions only. The real chart examples use historical data and do not guarantee future results. Read the full risk disclosure.