
What Is Divergence?
Reading RSI Signals for a Pause or Reversal
Divergence is when price and the RSI move in opposite directions, a sign that the chart may “pause or reverse”. Learn to read all 4 patterns of classic divergence and hidden divergence, with real gold chart examples.
Quick summary before you read
- Divergence is when price and the RSI move in opposite directions · it tells you the chart may “pause or reverse”, not that it will always reverse
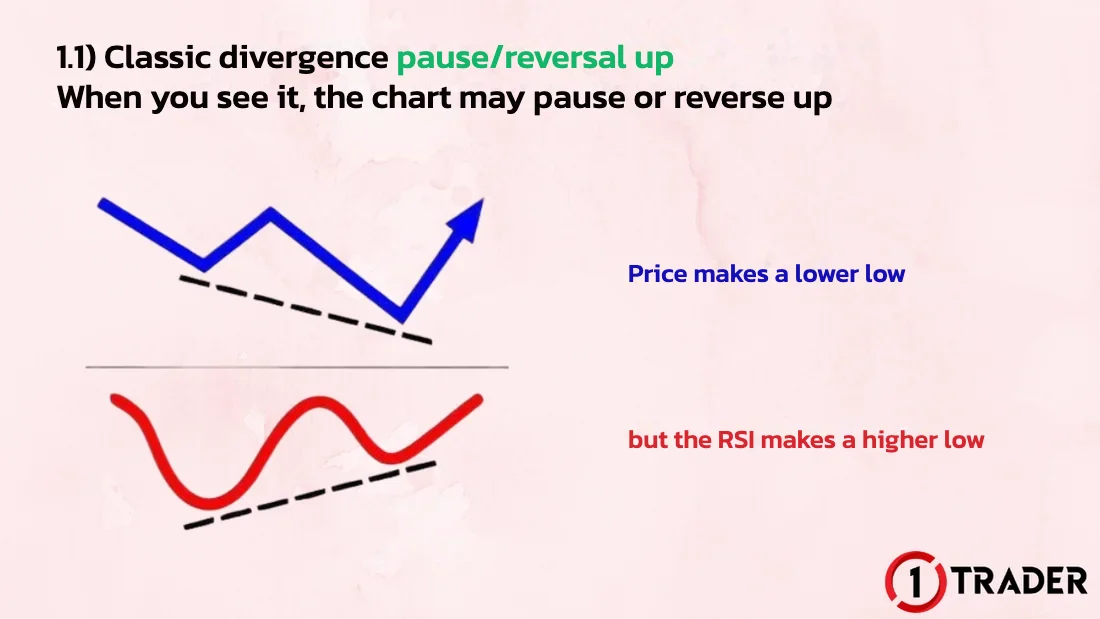
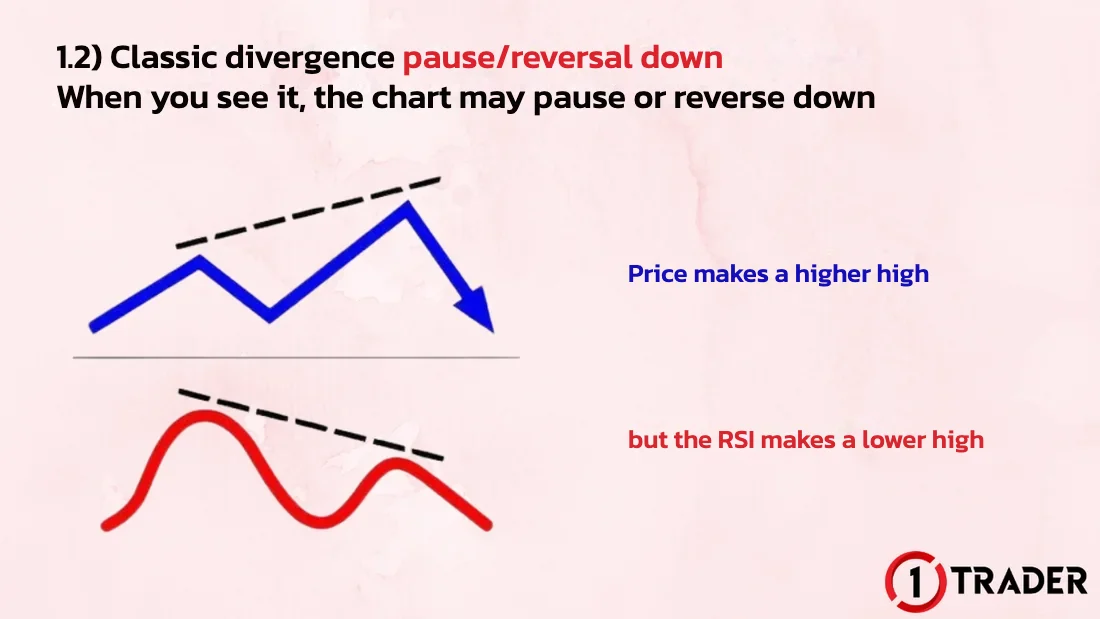
- Classic: price makes a lower low but the RSI makes a higher low = pause or reversal up · price makes a higher high but the RSI makes a lower high = pause or reversal down
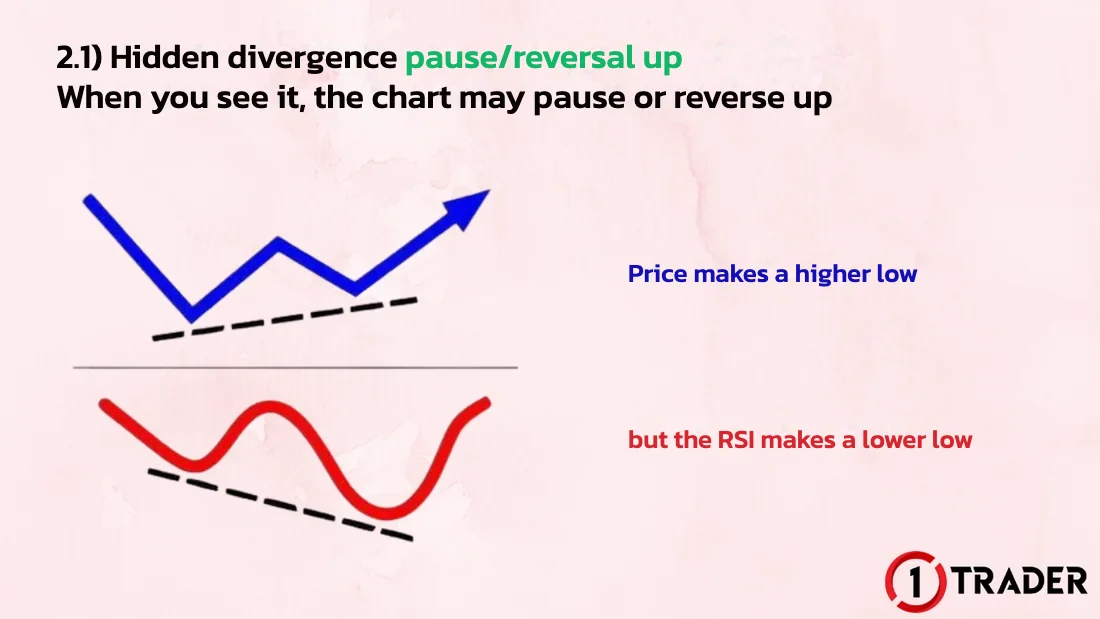
- Hidden: price makes a higher low but the RSI makes a lower low = pause or reversal up · price makes a lower high but the RSI makes a higher high = pause or reversal down
- When divergence appears, first assume price may pause to the nearest support or resistance · always check the higher timeframe too
- Find signals automatically for free with Divergence for Many Indicators v4 on TradingView, see section 06
Previous lessons: EP1 Trends · EP2 Sideways markets · EP3 Trend reversals · EP4 Speed line · EP5 Demand & supply zones · EP6 Fair value gap (FVG)
What is divergence?
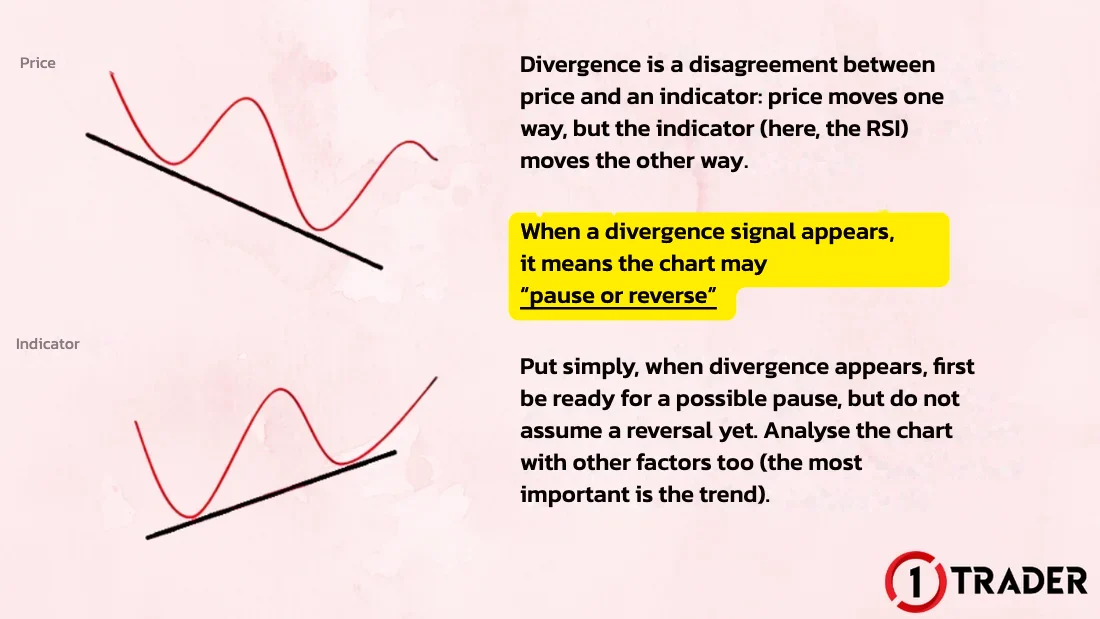
Divergence is a disagreement between price and an indicator: price moves one way, but the indicator (the RSI in this lesson) moves the other way.
A divergence signal means the chart may “pause or reverse”. At first, be ready for a pause, but do not assume a reversal yet. Analyse the chart with other factors too (the most important is the trend).
Types of divergence
Divergence signals come in 2 main types, classic divergence and hidden divergence, and each has 2 variations, for a total of 4 patterns.
1) Classic Divergence
Classic divergence: pause or reversal up
When you see this signal, the chart may pause or reverse up
Classic divergence: pause or reversal down
When you see this signal, the chart may pause or reverse down
2) Hidden Divergence
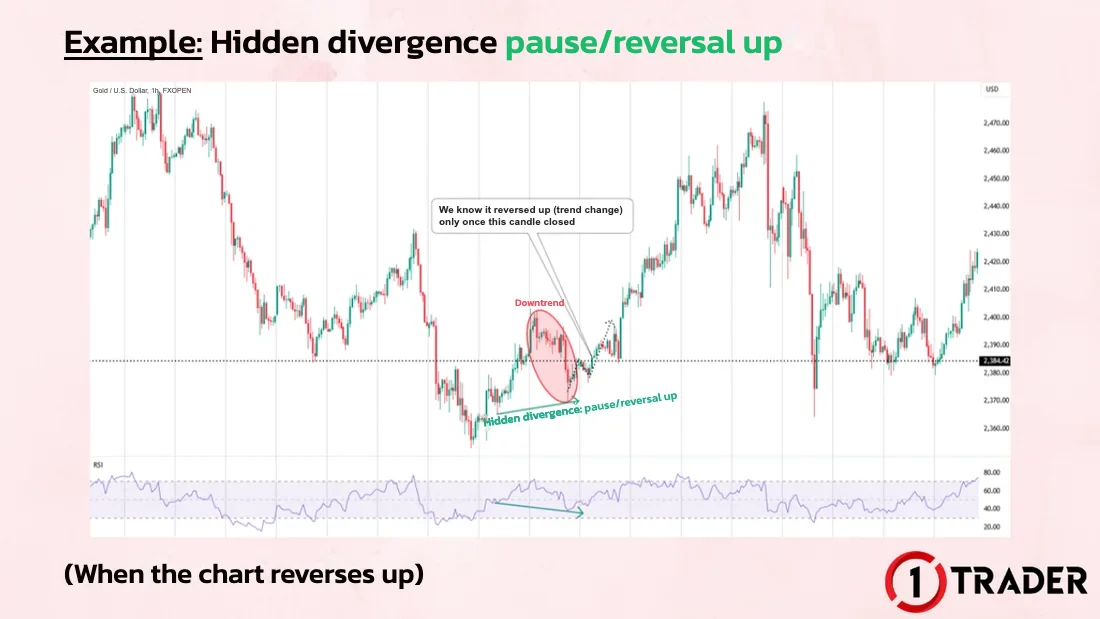
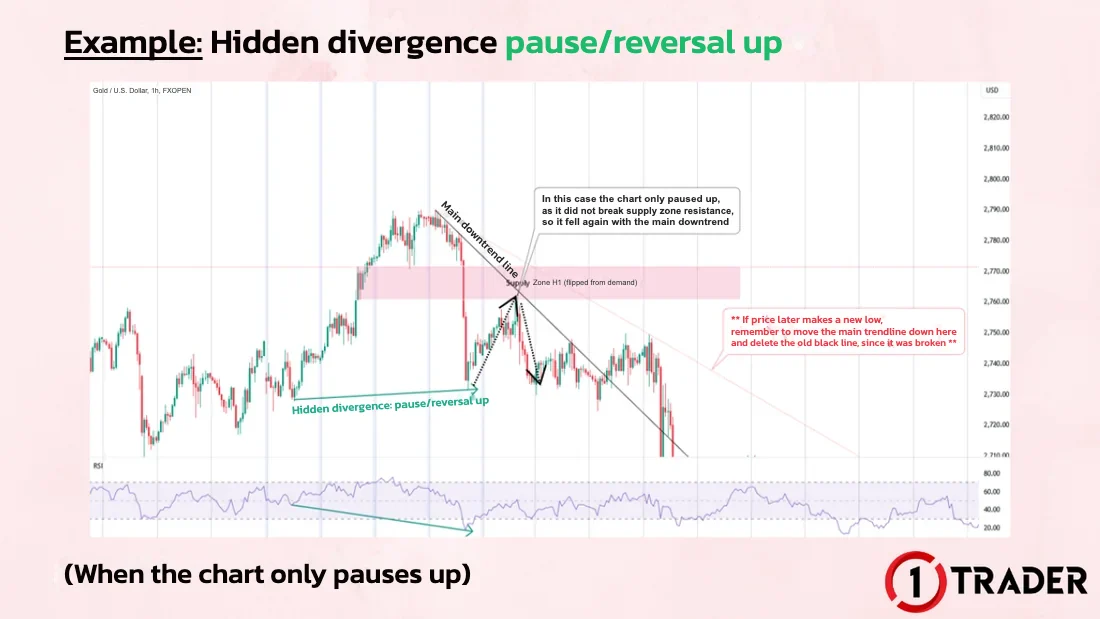
Hidden divergence: pause or reversal up
When you see this signal, the chart may pause or reverse up
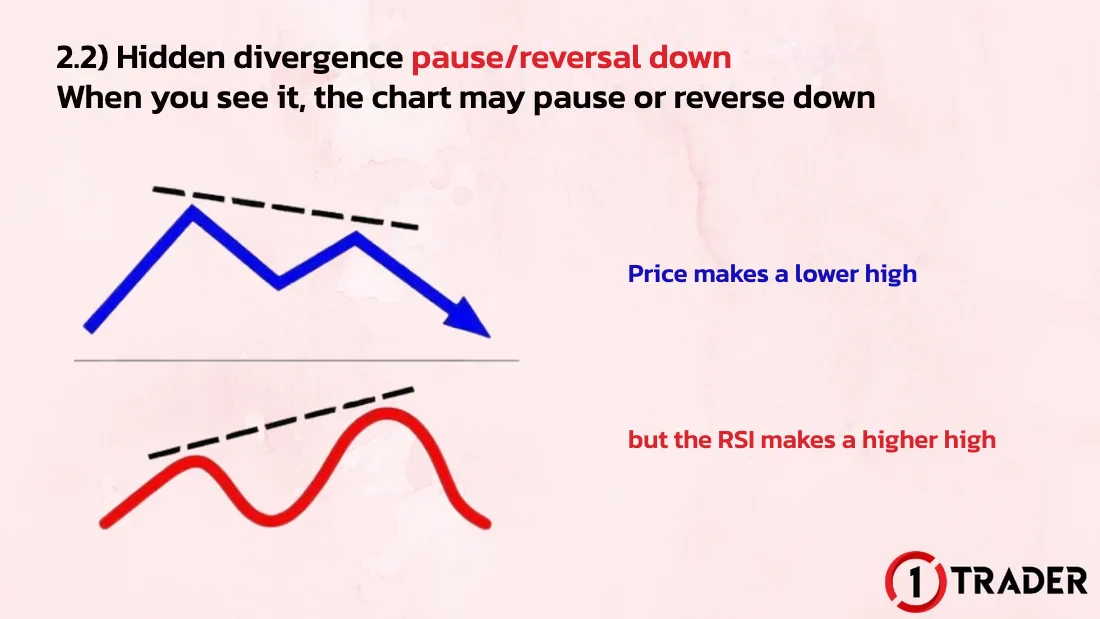
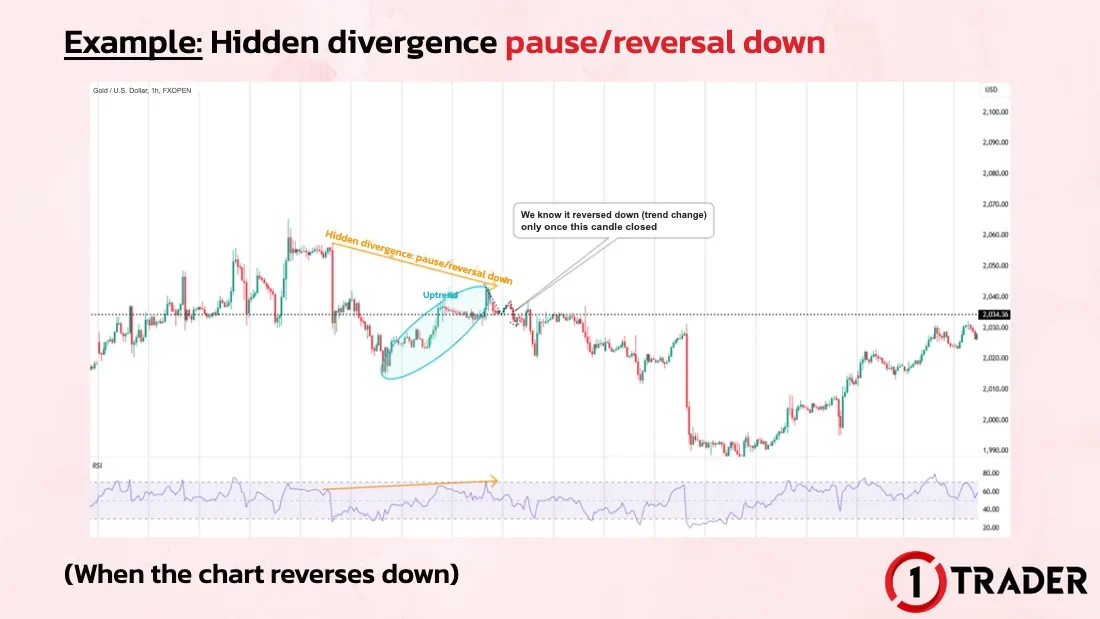
Hidden divergence: pause or reversal down
When you see this signal, the chart may pause or reverse down
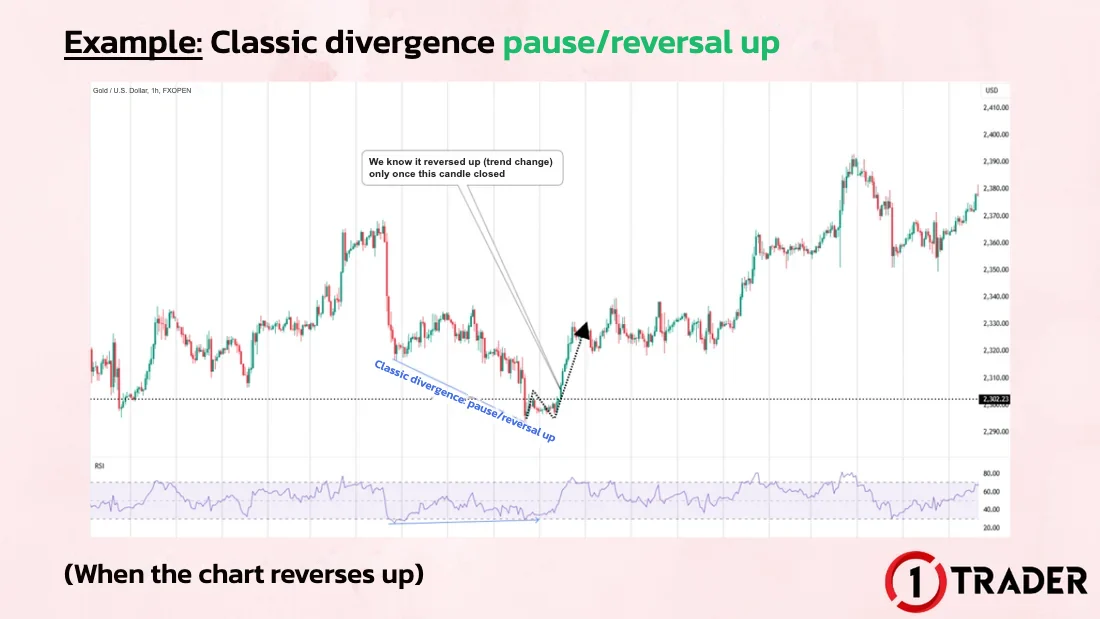
Classic divergence on a gold chart
Classic divergence: pause or reversal up
The chart turns into an uptrendReversal
When the signal appeared, the current trend was down. Only later did it turn out to be a classic divergence reversal up, because it pushed the chart into uptrend conditions (higher highs and higher lows).
Up to a supply zone, then down againPause only
Only later did it turn out to be a classic divergence pause up, because it only pushed the chart up to resistance at an H1 supply zone before selling pushed it down to a new low with the main downtrend.
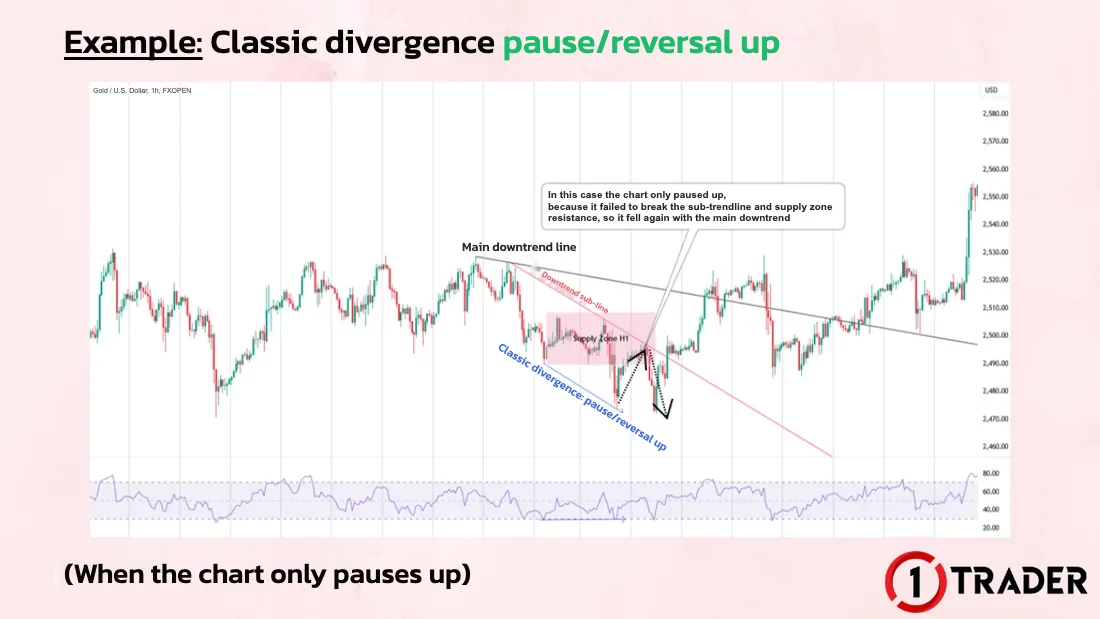
How can you tell whether a divergence signal will lead to a pause or a reversal?
In real time, there is no way to know for sure. You can only estimate it by analysing several timeframes. For example, in the reversal-up case above, the classic divergence appeared during a downtrend on H1, but the H4 chart was in an uptrend, so the signal was likely to be a reversal up that followed the H4 trend.
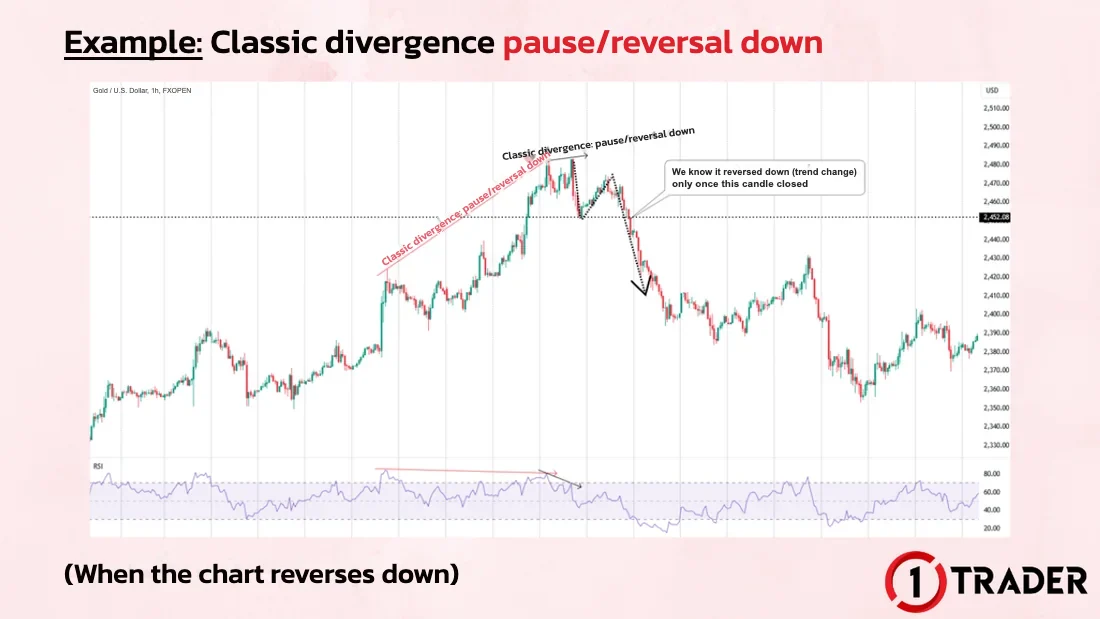
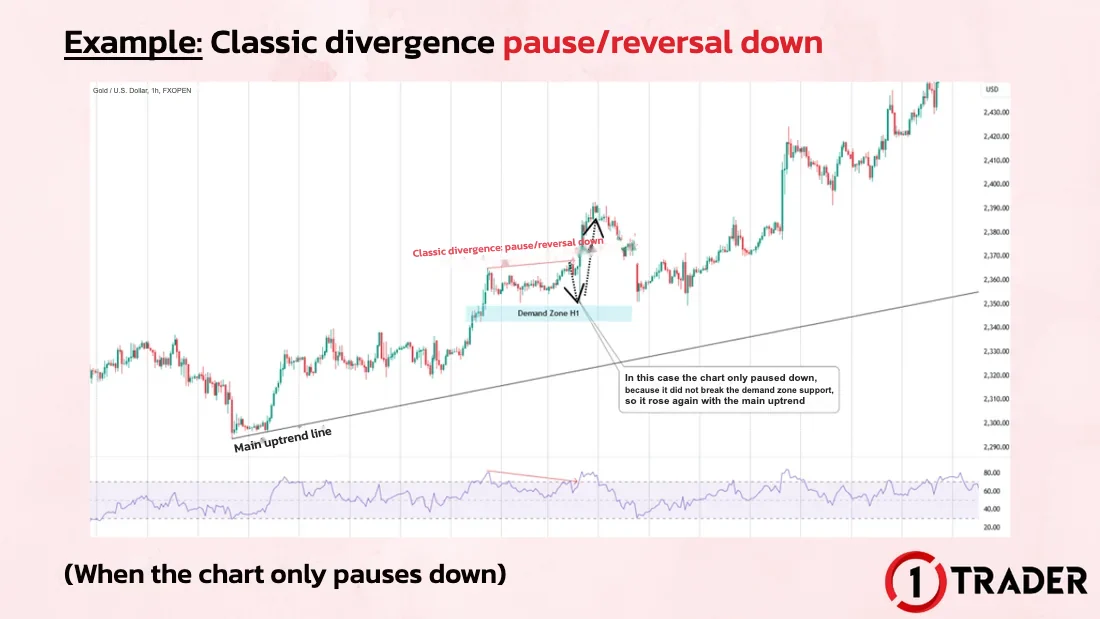
Classic divergence: pause or reversal down
Two signals in a row → downtrendReversal
When it appeared, the chart was in an uptrend. This example is special because two classic divergences formed close together, which makes a pause or reversal down more likely. Only later did it turn out to be a reversal down, because it pushed the chart into downtrend rules (lower highs and lower lows).
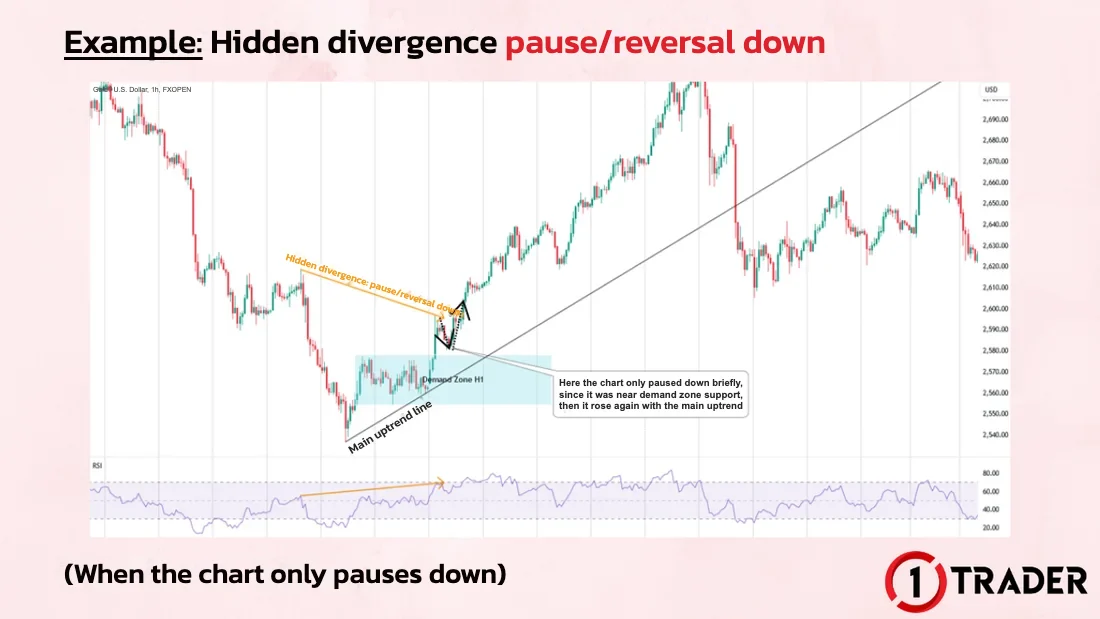
Down near a demand zone, then up againPause only
Only later did it turn out to be a classic divergence pause down, because it only pushed the chart down near support at an H1 demand zone before buying pushed it up to a new high with the main uptrend.
More tips for using divergence signals
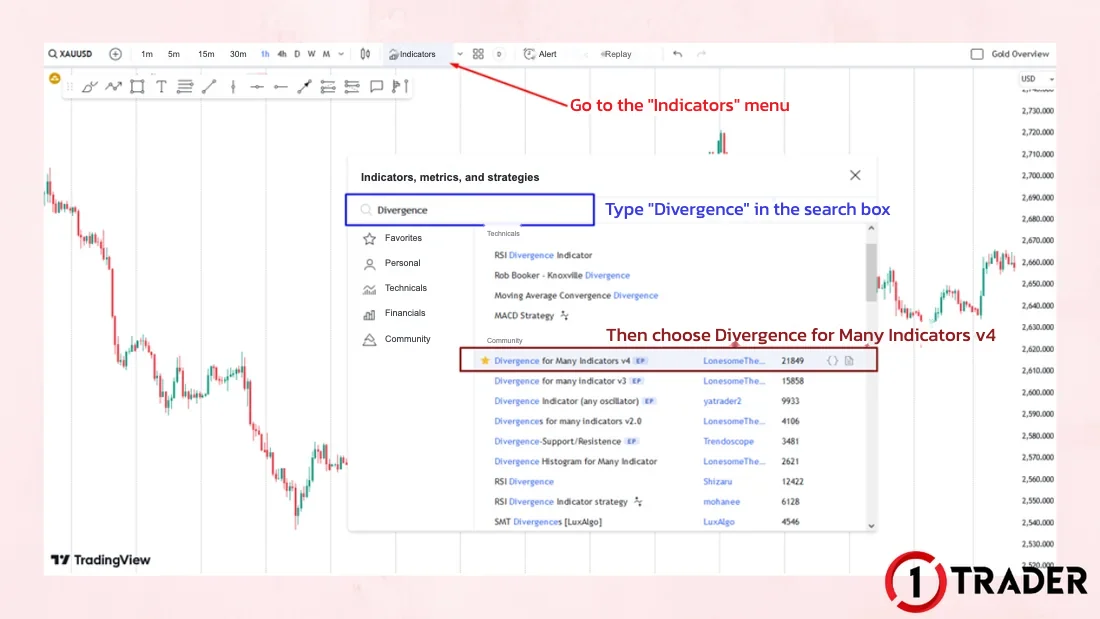
An indicator that finds divergence automatically on TradingView
Divergence can look hard to spot because there are several types. Don’t worry: there is a TradingView indicator that shows RSI divergence very well, and it is free to use.
Search for Divergence for Many Indicators v4
Summary: the 4 divergence patterns
| Type | Price | RSI | Signal | Just a pause if |
|---|---|---|---|---|
| Classic · up | Lower low | Higher low | Pause/reversal up | Hits resistance, then falls with the downtrend |
| Classic · down | Higher high | Lower high | Pause/reversal down | Reaches support, then rises with the uptrend |
| Hidden · up | Higher low | Lower low | Pause/reversal up | Hits resistance, then falls with the downtrend |
| Hidden · down | Lower high | Higher high | Pause/reversal down | Reaches support, then rises with the uptrend |
| Real reversal | Breaks the old trend rules | — | Meets the new trend rules | Use the higher timeframe to estimate |
The key to using divergence: treat it as a “pause or reverse” signal. Start by expecting price to pause to the nearest support or resistance, confirm a reversal only when the trend structure really changes, and always combine it with the higher-timeframe trend.
FAQ about divergence
What is divergence?
Divergence is a disagreement between price and an indicator (the RSI in this lesson): price moves one way, but the RSI moves the other way. A divergence signal means the chart may pause or reverse.
How many types of divergence are there?
There are 2 main types, classic divergence and hidden divergence. Each has a pause/reversal-up version and a pause/reversal-down version, for a total of 4 patterns.
How do you spot classic divergence?
For a pause or reversal up, price makes a lower low but the RSI makes a higher low. For a pause or reversal down, price makes a higher high but the RSI makes a lower high.
How do you spot hidden divergence?
For a pause or reversal up, price makes a higher low but the RSI makes a lower low. For a pause or reversal down, price makes a lower high but the RSI makes a higher high.
Does the chart always reverse after divergence?
Not always. Divergence means the chart may pause or reverse. Often it is just a small pause to the nearest support or resistance before price continues with the trend. A reversal is confirmed only when the chart breaks the old trend rules and meets the rules of the new trend.
How can you tell whether divergence will lead to a pause or a reversal?
There is no way to know for sure when the signal appears. You can only estimate it by analysing several timeframes. For example, if a classic divergence for a pause or reversal up forms in an H1 downtrend while H4 is in an uptrend, H1 is likely to reverse up and follow H4.
Which TradingView indicator finds divergence automatically?
Search for Divergence in the TradingView indicators menu and choose Divergence for Many Indicators v4. It shows RSI divergence well and is free to use.
Read EP6 again Next lesson · EP8 What Is FIBO? Entering at the Wick Tip with Fibonacci Draw FIBO for support and resistance · 1.618 2.618 3.618 4.236 · M5 gold chart
Read EP8 →
See all lessons in the free Forex and gold trading course
Risk warning: Trading Forex, gold and CFDs carries a high level of risk and you may lose money. 1TRADER provides information and education to support your own decisions only. The real chart examples use historical data and do not guarantee future results. Read the full risk disclosure.