
Find Entries with RSI: 2 Practical Techniques
Learn RSI with the 14 setting and 70/30 levels, then find entries with overbought/oversold and RSI divergence, both classic and hidden, picking the side that matches the trend.
Quick summary before you read
- RSI measures buying and selling pressure from 0–100, with a standard setting of 14 candles and 70/30 levels
- Technique 1: overbought (above 70) consider selling · oversold (below 30) consider buying, choosing the side that matches the trend
- Technique 2: RSI divergence, where price and RSI move in opposite directions, with 2 classic and 2 hidden types
- RSI helps with timing; always use it with the trend, support and resistance, and a stop loss
Previous lessons: EP1 Trends · EP2 Sideways markets · EP3 Trend reversals · EP4 Speed line · EP5 Demand & supply zones · EP6 FVG · EP7 Divergence · EP8 FIBO · EP9 Money management · EP10 Free backtesting · EP11 Stochastic · EP12 Bollinger Bands · EP13 Starting capital · EP14 Sniper (All-in) · EP15 Free TradingView · EP16 Zone indicator
What is RSI, and what is it for?
- Created by
- J. Welles Wilder, in his 1978 book
- Range
- 0–100; higher means more buying pressure, lower means more selling pressure
- Default
- Calculated from the last 14 candles
- Formula
- RSI = 100 − 100 ÷ (1 + RS), where RS = average gain ÷ average loss
- Key levels
- 70 overbought · 50 midline · 30 oversold
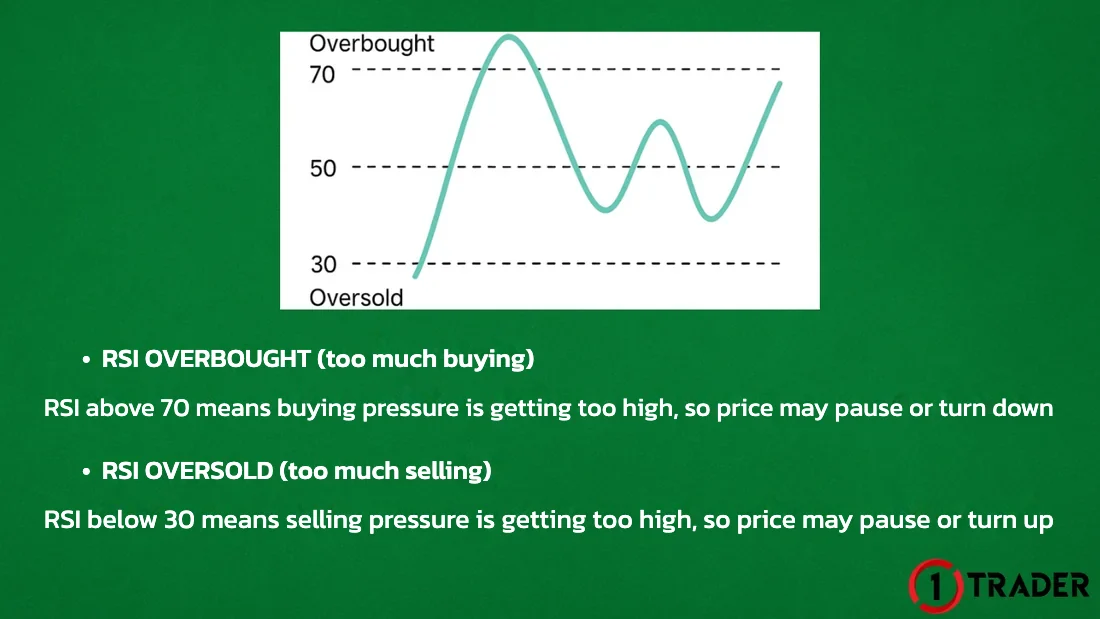
This lesson covers 2 main techniques for finding entries with RSI: entering on overbought/oversold and entering on RSI divergence, which builds on EP7 Divergence.
RSI settings in TradingView and MT4
Beginners should start with the standard 14 and 70/30. Some traders switch to 80/20 in strong trends to cut false signals, but you get fewer signals. If you change it, backtest it before trading live.
Technique 1: enter on overbought / oversold
Buying pressure is getting too high, so price may pause or turn down
Selling pressure is getting too high, so price may pause or turn up
In a strong trend, RSI can stay overbought or oversold for a long time. Andrew Cardwell observed that RSI tends to swing between 40–80 in uptrends and 20–60 in downtrends, so in a downtrend RSI may not bounce to 70, and in an uptrend it may not dip to 30. Never trade against the trend just because RSI crossed a line.
Technique 2: enter on RSI divergence
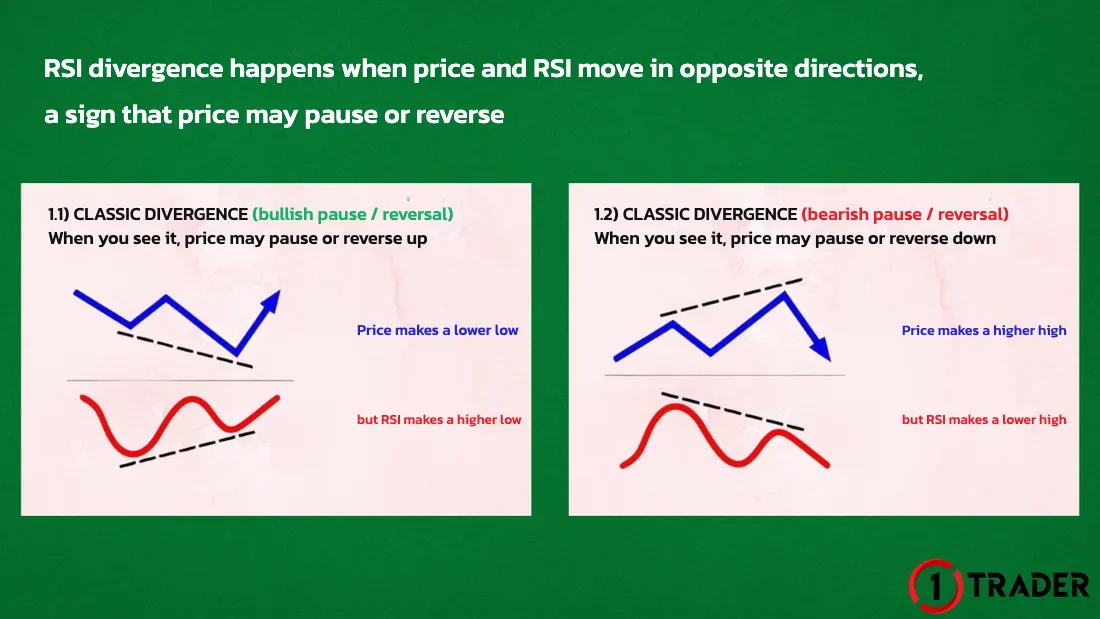
RSI divergence happens when price and RSI move in opposite directions, a sign that price may pause or reverse. Read the details in EP7 What is divergence.
- 1.1 Classic bullish
- Price makes a lower low, but RSI makes a higher low → consider buying
- 1.2 Classic bearish
- Price makes a higher high, but RSI makes a lower high → consider selling
- 2.1 Hidden bullish
- Price makes a higher low, but RSI makes a lower low → consider buying
- 2.2 Hidden bearish
- Price makes a lower high, but RSI makes a higher high → consider selling
1. Classic Divergence
2. Hidden Divergence
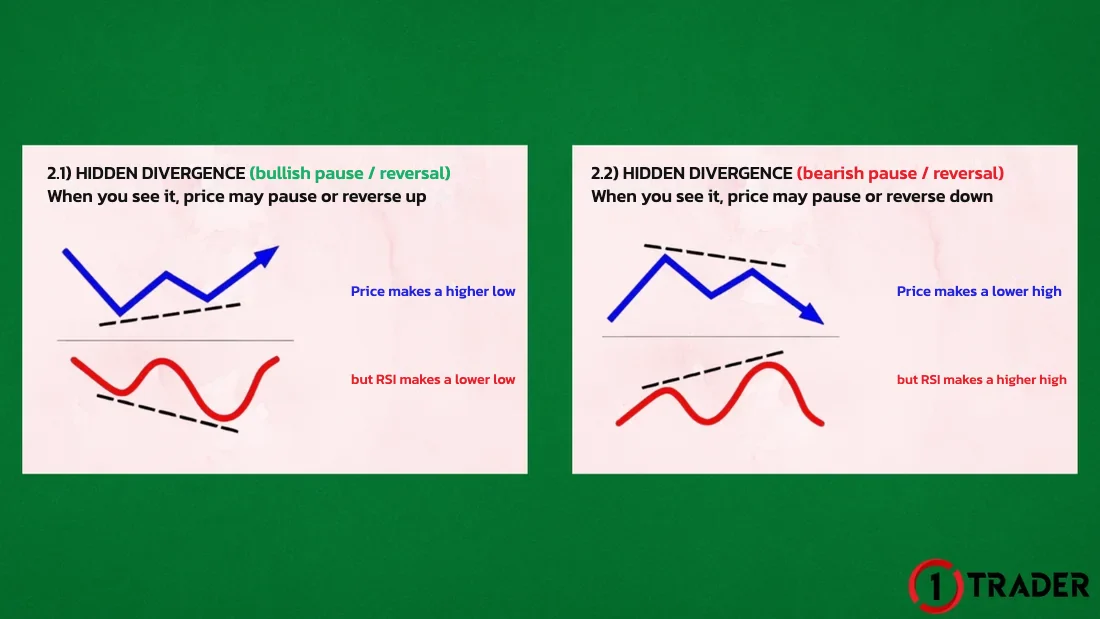
Classic divergence often appears at the end of a trend, warning that momentum is fading. Hidden divergence often appears mid-trend, signalling that price may continue in the same direction after a pullback or bounce, so it suits trading with the trend.
5-step checklist before an RSI entry
RSI limitations and cautions
RSI signal summary
| Signal | What RSI shows | Side | Use with |
|---|---|---|---|
| Overbought | RSI above 70 | Consider selling | Downtrend + resistance |
| Oversold | RSI below 30 | Consider buying | Uptrend + support |
| Classic bullish | Price lower low, RSI higher low | Consider buying | End of a downtrend + confirmation candle |
| Classic bearish | Price higher high, RSI lower high | Consider selling | End of an uptrend + confirmation candle |
| Hidden bullish | Price higher low, RSI lower low | Consider buying | An uptrend that is pulling back |
| Hidden bearish | Price lower high, RSI higher high | Consider selling | A downtrend that is bouncing |
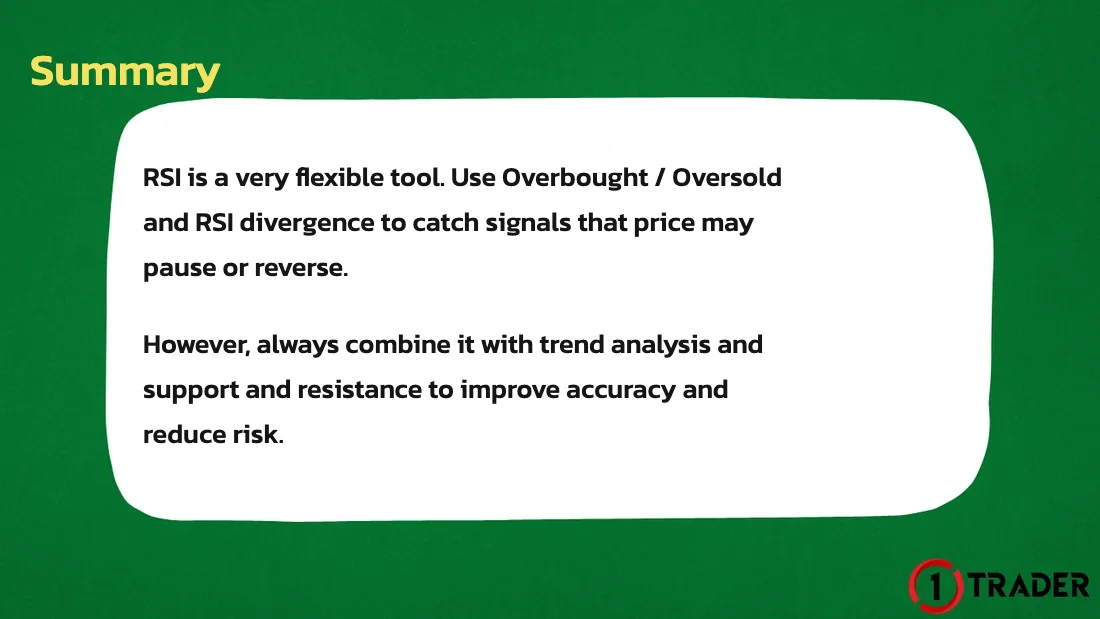
RSI is a very flexible tool: use both overbought/oversold and RSI divergence to catch signs that price may pause or reverse, but combine it with trend analysis and support and resistance to improve your odds and reduce risk.
FAQ about RSI
What RSI settings should I use?
The standard is 14 candles, as used by RSI’s creator J. Welles Wilder, with levels at 70 and 30. Both TradingView and MT4 use these by default. Beginners should keep them; some traders switch to 80/20 to reduce signals in strong trends.
Should I sell as soon as RSI goes above 70?
No. RSI above 70 only means buying pressure is very high. In a strong uptrend RSI can stay above 70 for a long time while price keeps rising. Check the trend and resistance, and wait for a confirmation candle before selling.
How is overbought/oversold different from divergence?
Overbought/oversold only looks at whether RSI is above 70 or below 30. Divergence compares the highs or lows of price with RSI moving in opposite directions, so it can show fading momentum earlier.
How are classic and hidden divergence used differently?
Classic divergence often appears at the end of a trend, warning that price may pause or reverse. Hidden divergence often appears when price pulls back within a trend, signalling that price may continue in the same direction.
Which timeframe is best for RSI?
It works on any timeframe, but small ones like M1–M5 give many false signals. Check the trend and zones on H1 or H4 first, then use RSI on M5–M15 to time your entry.
How is RSI different from Stochastic?
RSI compares average gains with average losses, while Stochastic compares the close with the recent high–low range. So Stochastic swings faster and gives more signals. The same overbought/oversold and divergence ideas apply to both.
Can I trade with RSI alone?
It’s not recommended. RSI is a timing aid; use it with the trend, support and resistance or zones, always set a stop loss and size your lot, and backtest before using real money.
Read EP16 again Next lesson · EP18 Free Divergence Indicators for TradingView and MT4 MT4 RSI Divergence Indicator · Divergence for Many Indicators v4 · setup
Read EP18 →
See all lessons in the free Forex and gold trading course
Risk warning: Trading Forex, gold and CFDs carries a high level of risk and you may lose money. 1TRADER provides information and education to support your own decisions only. Indicator signals do not guarantee future results. Read the full risk disclosure.