
What Is Multi-Timeframe Analysis? Top-Down from D1 to M5
Read the same chart on several timeframes: the big picture gives the direction, the small picture gives the entry timing. With the D1 → H4 → H1 → M5 steps and a real gold buy-plan example.
Quick summary before you read
- Multi-timeframe or top-down analysis means reading the same chart on several timeframes: the big picture gives the direction, the small picture gives the entry timing
- 4 timeframe steps: D1 for the main trend → H4 for the minor structure → H1 for confirmation → M5 for the entry and a tight SL
- Gold example, 20 Aug 2025: D1 uptrend, H4/H1 pulled back into an H1 demand zone; buy plan with TP 3,330, SL 3,307, RR ≈ 1.78
- When timeframes disagree, follow the higher timeframe; 3–4 timeframes is enough
Previous lessons: EP1 Trends · EP2 Sideways markets · EP3 Trend reversals · EP4 Speed line · EP5 Demand & supply zones · EP6 FVG · EP7 Divergence · EP8 FIBO · EP9 Money management · EP10 Free backtesting · EP11 Stochastic · EP12 Bollinger Bands · EP13 Starting capital · EP14 Sniper (All-in) · EP15 Free TradingView · EP16 Zone indicator · EP17 RSI · EP18 Divergence indicator
What is multi-timeframe analysis?
For example, you analyse from D1 (daily), H4 (4 hours) and H1 (1 hour) down to M5 (5 minutes), then combine everything to time entries and exits. The problem with a single timeframe is that M5 can look like a clear downtrend when it is really just a small pullback in a D1 uptrend.
3 principles of top-down analysis
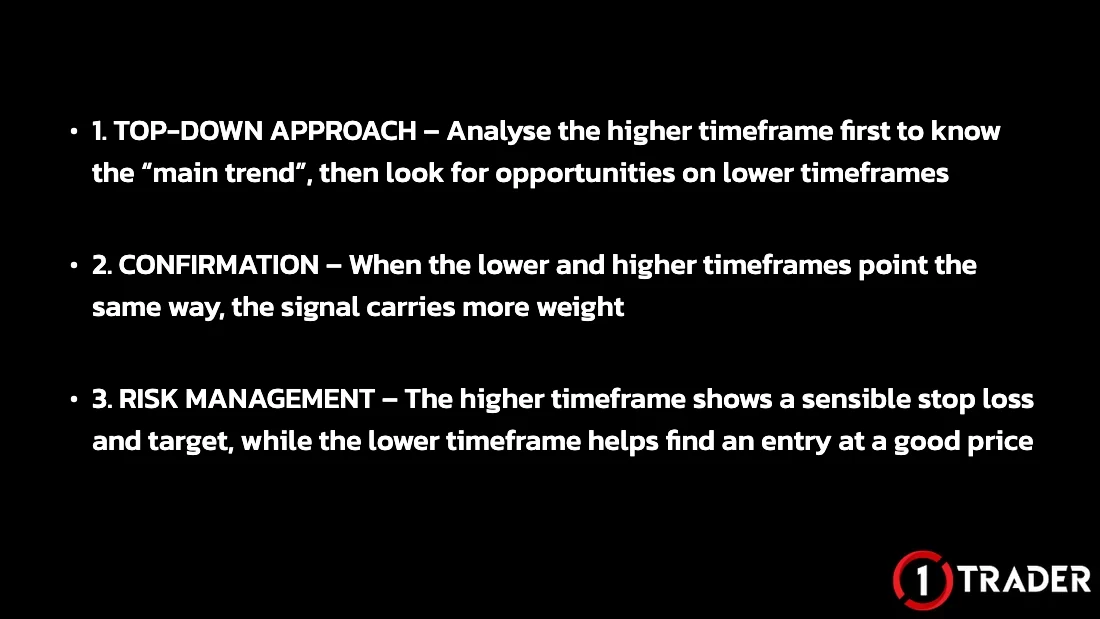
- 1 Top-down approach
- Analyse the higher timeframe first to know the main trend, then look for opportunities on lower timeframes
- 2 Confirmation
- When the lower and higher timeframes point the same way, the signal carries more weight
- 3 Risk management
- The higher timeframe shows a sensible stop loss and target; the lower timeframe helps you find an entry at a good price
This idea is similar to Alexander Elder’s Triple Screen system, which uses 3 timeframes about 4–6 times apart, such as D1 → H4 → H1. Too far apart and the pictures are hard to connect; too close and you see the same information twice.
Analysis steps: D1 → H4 → H1 → M5
Work from the higher timeframe down; each timeframe has its own job. Use the trend reading from EP1 Trends and trendlines and the zones from EP5 Demand & supply zones.
See the big picture
Benefit: stops you trading against the main trend without realising it
See the minor structure
Benefit: more detail, so you can plan where to wait for an entry
Find confirmation
Benefit: confirms the signal so you enter with more confidence
Find the entry and exit
Benefit: more precise entries and less risk per trade
Timeframe sets by trading style
The D1–H4–H1–M5 set suits day trading. If you hold trades for shorter or longer, shift the set accordingly.
- Swing trading
- W1 → D1 → H4 (held for days to weeks)
- Day trading
- D1 → H4 → H1 → M5/M15 (the set in this article)
- Scalping
- H1 → M15 → M1/M5 (held for a few minutes)
A multi-timeframe example on a real gold chart
Gold (XAUUSD) on 20 August 2025: on H4 and H1 price was falling, but D1 was still in an uptrend and price had reached an H1 demand zone, so the plan was a buy in line with the big picture.
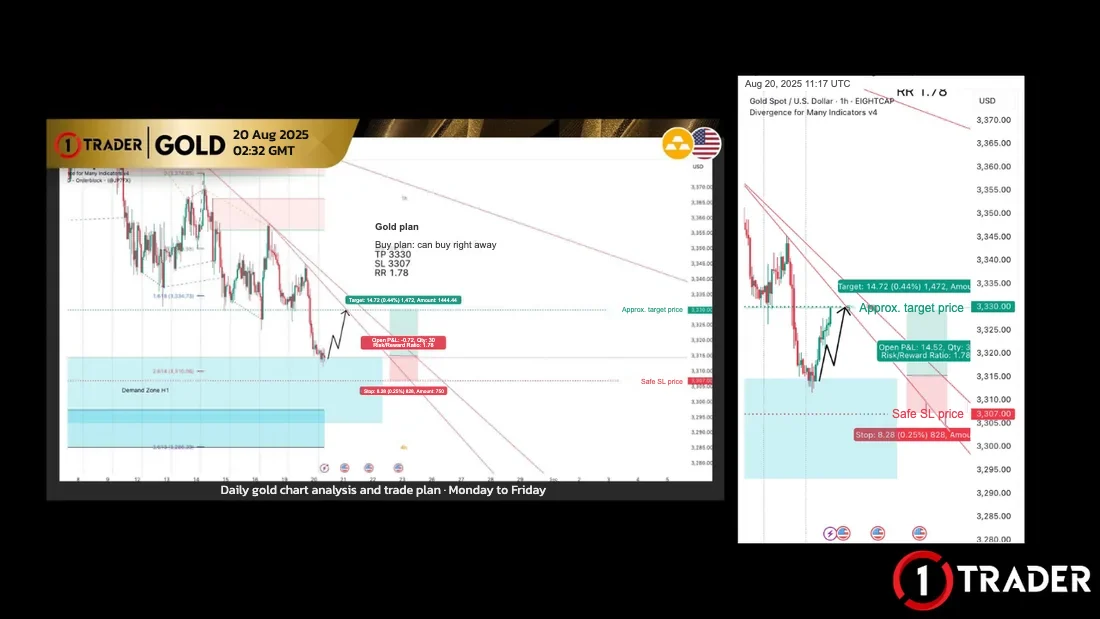
- D1
- Uptrend → focus on buys
- H4 / H1
- Pulling back down towards support (temporarily against D1)
- Entry zone
- H1 demand zone around 3,295–3,315, lining up with FIBO 2.618 (3,310)
- Plan
- Buy right away at about 3,315 · TP 3,330 · SL 3,307 (a safe SL below the zone)
- Risk/reward
- 14.72 points profit ÷ 8.28 points loss ≈ 1.78
- Result
- Price bounced from the zone up near the 3,330 target, as planned
Looking at H1 alone, you would see a downtrend and might sell, which means selling at support against the D1 trend. Multi-timeframe analysis shows the H1 drop is only a pullback, so you wait to buy at the zone instead. If price closes below the zone past the SL, the plan was wrong: exit as planned straight away.
Pros and cautions of multi-timeframe analysis
Practise on past charts with the free backtesting sites (EP10), and always size your lot from the SL distance as in EP9 Money management before using real money.
Summary: the role of each timeframe
| Timeframe | Role | What to look at | Outcome |
|---|---|---|---|
| D1 daily | See the big picture | Main trend, major support and resistance | Know whether to focus on buys or sells |
| H4 four hours | See the minor structure | Pullbacks or bounces, zones to wait at | Plan zones and targets |
| H1 one hour | Find confirmation | Demand/supply zones, reversal candles | Confirm it’s time to consider an entry |
| M5 five minutes | Find the entry and exit | Higher high / higher low or lower high / lower low | Precise entry, tight SL, better RR |
Multi-timeframe trading combines views from several timeframes using the idea “the big picture gives the direction, the small picture gives the entry timing”. If you want to trade more systematically and make fewer mistakes, multi-timeframe analysis is a foundation you shouldn’t skip.
FAQ about multi-timeframe analysis
What is multi-timeframe analysis?
Multi-timeframe or top-down analysis means analysing the same price chart on several timeframes. Start with the higher timeframe to see the main trend and key support and resistance, then move down to lower timeframes to time entries and exits and set a tighter stop loss.
How many timeframes should I use?
3–4 timeframes is common, such as D1, H4, H1 and M5 in this article. More than that often gives conflicting signals and leaves you unable to decide. Choose a set that suits your trading style and use the same set every time.
What if the higher and lower timeframes disagree?
Follow the higher timeframe. A lower timeframe moving the other way is usually just a pullback or bounce. Wait for price to reach support, resistance or a key zone, then wait for a reversal signal on the lower timeframe back in the higher timeframe’s direction before entering.
Do short-term traders or scalpers need to check D1?
At least check one or two timeframes above the one you trade. For example, if you trade M1–M5, also look at H1 and M15. Seeing the major support and resistance stops you entering right into a level where price often turns.
Can I use multi-timeframe analysis with indicators?
Yes. For example, use RSI or divergence on a lower timeframe to time entries at a zone found on the higher timeframe. But don’t watch several indicators on every timeframe at once, because you’ll get too many conflicting signals.
Why go down to M5 for the entry?
A lower timeframe lets you place the stop loss closer to your entry. With a tighter SL but a target still taken from the higher timeframe, the risk/reward improves. M5 gives many false signals, though, so use it only when price has reached your planned zone.
What date is the gold chart example from?
It is the gold (XAUUSD) chart from 20 August 2025: a buy plan at the H1 demand zone with TP 3,330 and SL 3,307, for a risk/reward of about 1.78. The example only explains the thinking and is not a trading signal.
Read EP18 again Next · Free trading course See all lessons in the course Six stages, from chart basics to trade planning. More English lessons are coming soon.
View the course →
See all lessons in the free Forex and gold trading course
Risk warning: Trading Forex, gold and CFDs carries a high level of risk and you may lose money. 1TRADER provides information and education to support your own decisions only. The trade plan example in this article is for education; past results do not guarantee future results. Read the full risk disclosure.