
Breaking Down a USDJPY Trade Set-up: a Sniper Trade with 600%+ Profit from $20
A look back at a real USDJPY trade on 29 Aug 2025: how the D1 → H4 → H1 → M5 analysis led to a buy plan with TP 147.420 and SL 146.670, and the risks you must know before trading sniper-style.
Quick summary before you read
- A breakdown of a real USDJPY trade on 29 Aug 2025: buy right away, TP 147.420, SL 146.670, risk/reward about 2.47
- Multi-timeframe: D1 uptrend → H4 sideways near an H4 orderblock → H1 pullback testing an H1 orderblock next to the H4 OB → M5 buy when RSI nears oversold
- Trade history: total profit $139.10 on a $20.34 deposit, about 684%, from several buy orders
- Sniper trading can pay off big but risks the whole account if the plan is wrong; beginners should risk 1–2% per trade
Previous lessons: EP1 Trends · EP2 Sideways markets · EP3 Trend reversals · EP4 Speed line · EP5 Demand & supply zones · EP6 FVG · EP7 Divergence · EP8 FIBO · EP9 Money management · EP10 Free backtesting · EP11 Stochastic · EP12 Bollinger Bands · EP13 Starting capital · EP14 Sniper (All-in) · EP15 Free TradingView · EP16 Zone indicator · EP17 RSI · EP18 Divergence indicator · EP19 Multi-timeframe
The USDJPY trade set-up used that day
This article takes an interesting real trade and explains how the chart was read that day to arrive at the trade set-up. The case is USDJPY on 29 August 2025, which made over 600% on an account of about $20.
- Pair
- USDJPY · daily plan for 29 Aug 2025 at 02:58 GMT
- Side
- Buy right away at about 146.886
- TP
- 147.420 (0.534 or 53.4 pips from entry, near the H1 supply zone)
- SL
- 146.670 (0.216 or 21.6 pips from entry, a safe SL)
- Risk/reward
- 53.4 ÷ 21.6 ≈ 2.47, a reward of almost 2.5 times the risk
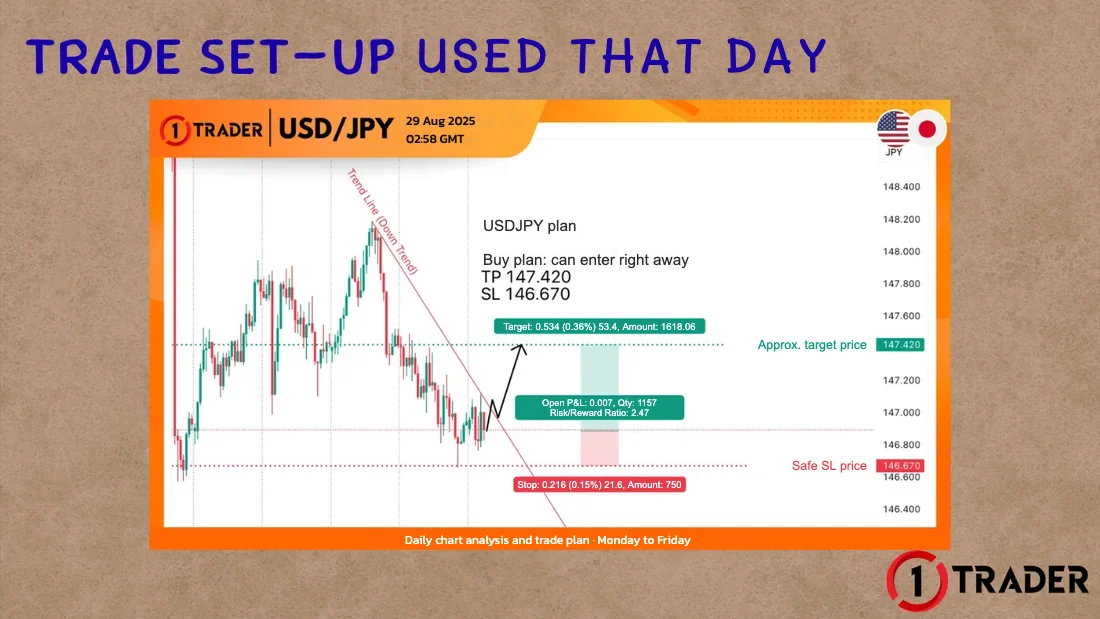
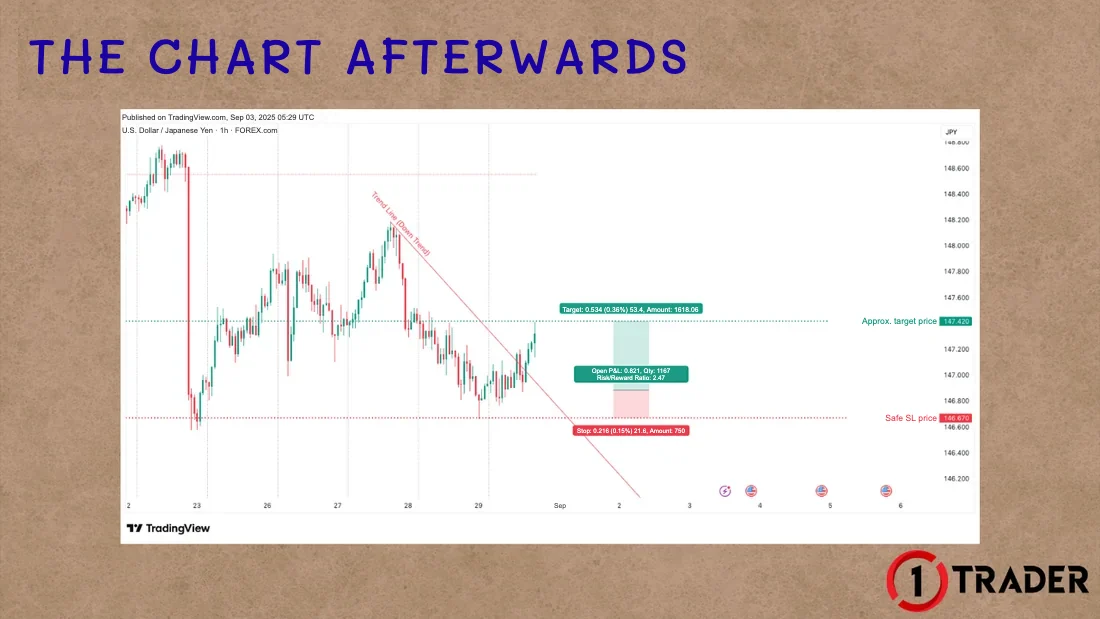
Multi-timeframe analysis for the trade set-up
Use the same idea as EP19 Multi-timeframe: check 2 things on every timeframe, the trend and support and resistance, working from the higher timeframe down.
Step 1 D1: uptrend
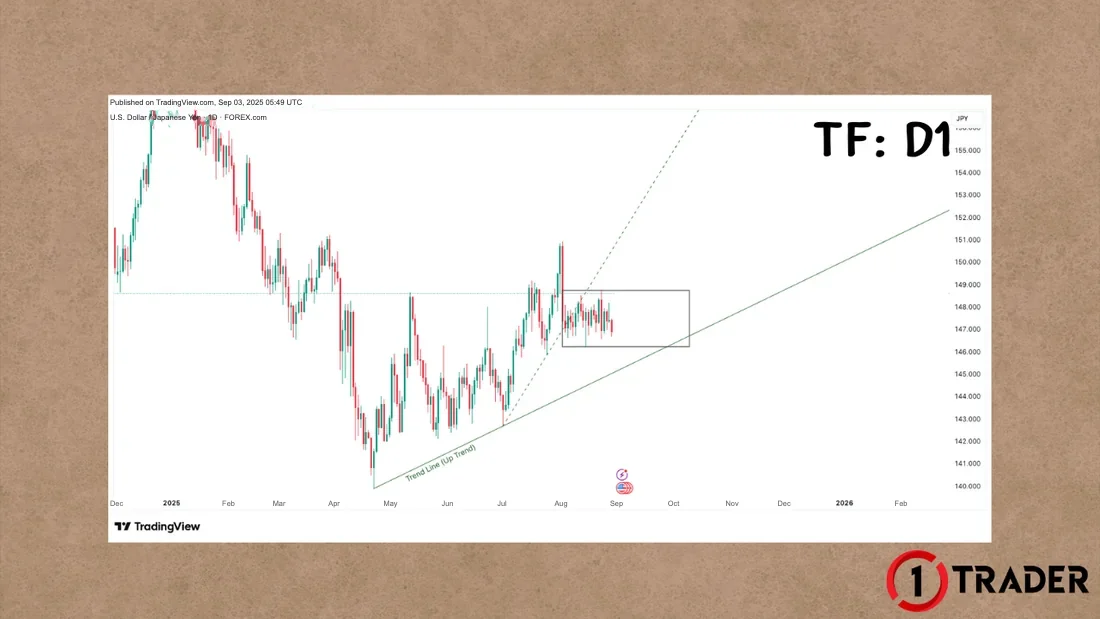
Step 2 H4: sideways near the H4 orderblock
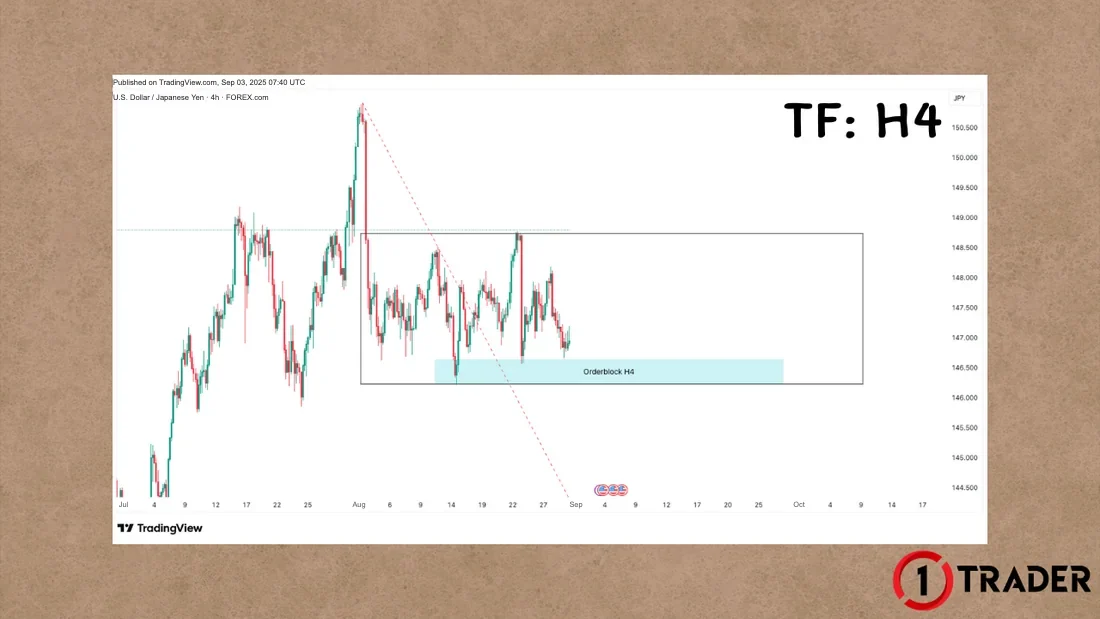
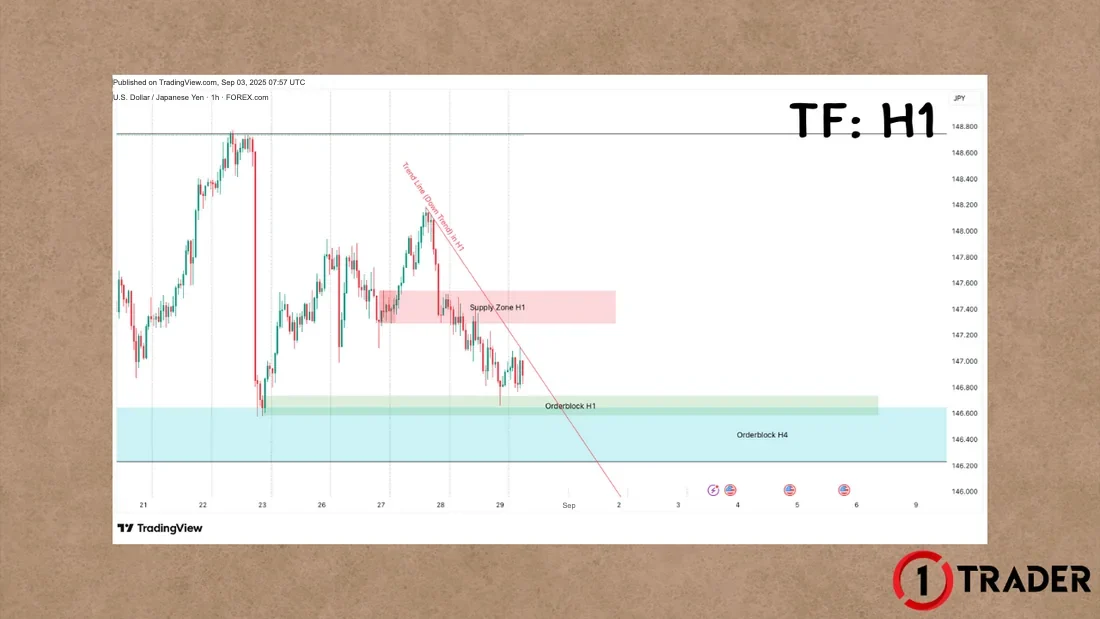
Step 3 H1: a downtrend pulling back into the orderblock
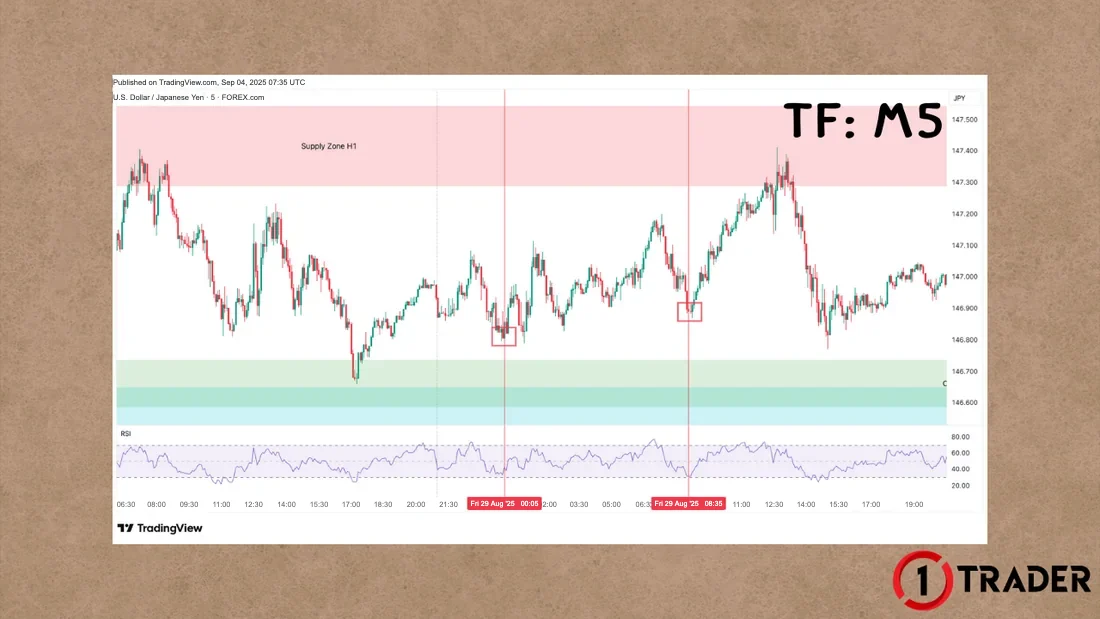
Step 4 M5: buy when RSI nears oversold
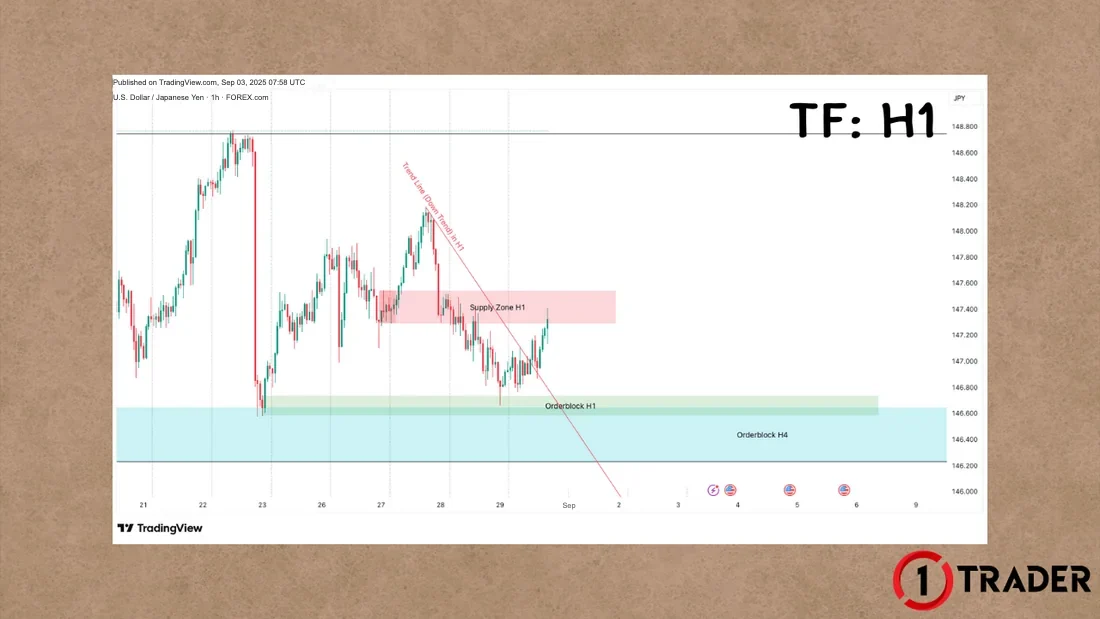
Looking at H1 alone, you would only see a downtrend and might sell at support. Across all timeframes, the H1 drop is just a pullback into support stacked from two timeframes, in the same direction as D1, which gives buys the edge here.
Results from the real trade history
- Deposit
- $20.34
- Total profit
- $139.10 ≈ 684% of the deposit
- Orders
- Several buys of 0.01 and 0.02 lots, entries 146.770–146.838
- Close
- About 147.107–147.115, before TP 147.420
- Afterwards
- Withdrew $99, leaving a balance of $60.44
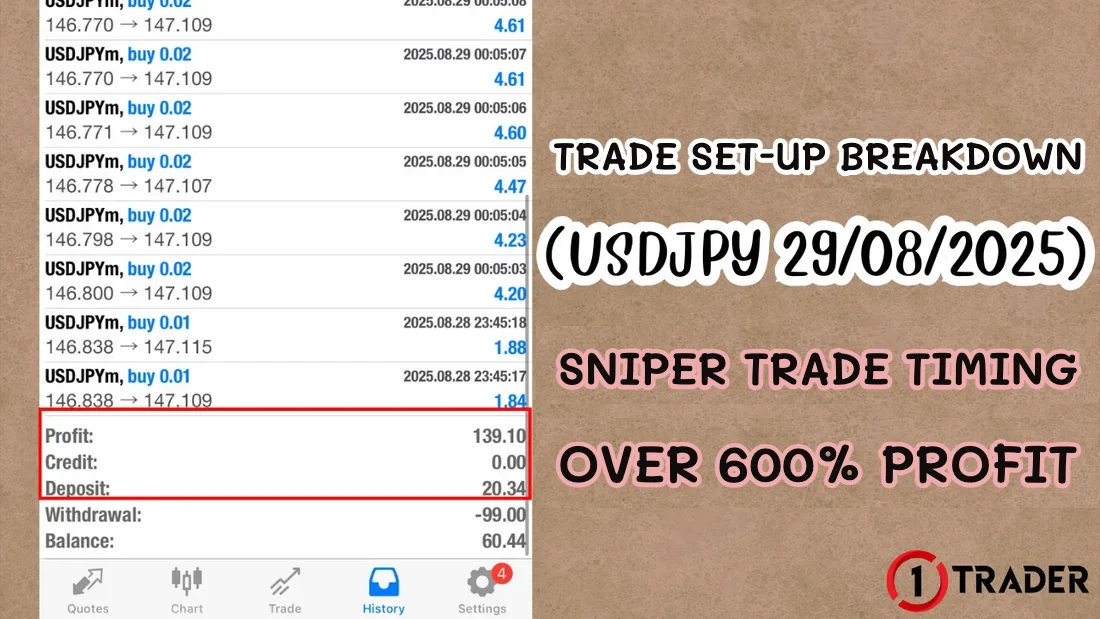
Checking the numbers: a 0.02-lot buy from 146.770 closed at 147.109 made 33.9 pips, or $4.61, which matches a USDJPY pip value of about $6.8 per pip per lot (1,000 yen ÷ 147). So the $139.10 total came from many orders combined, not a single trade.
The times in the history (28 Aug 23:45 and 29 Aug 00:05) are server time, GMT, matching the first entry on the M5 chart. The close at about 147.109 came before the TP at 147.420, even though price later reached the TP area.
The risks of sniper trading to know before you copy it
A sniper trade means waiting for the most confident moment, then opening a position that is large compared with your account. Returns can reach hundreds of percent, but the risk is just as high. Read the full idea in EP14 Sniper (All-in).
If price hits the SL
Say you buy at 146.800 with SL 146.670, a 13-pip distance
With 11 orders of 0.02 lot (0.22 lot in total)
$20 account risks $0.40
13-pip SL, using the formula from EP9
A standard account’s minimum is 0.01 lot, so you risk more than 2% from the first trade
Checklist for building your own trade set-up
Practise trade set-ups on past charts with the free backtesting sites (EP10). Record every plan, wins and losses, to see which plans really work before you use real money.
Summary: the factors on each timeframe in this case
| Timeframe | What we saw that day | Factor used | Effect on the plan |
|---|---|---|---|
| D1 | Uptrend along the green trendline | Support and resistance not yet clear | Focus on buys |
| H4 | Large sideways range 146.2–148.8 | H4 orderblock near the bottom | Buys start to carry more weight |
| H1 | Downtrend pulling back into the zone | H1 orderblock next to the H4 orderblock | Buy set-up with TP 147.420 and SL 146.670 |
| M5 | Price pulling back inside the zone | RSI falling near oversold | Buy entries at 00:05 and 08:35 GMT |
This case shows that a good trade set-up comes from reading the trend and support and resistance on every timeframe, then using a lower timeframe for the entry. The 600% profit came from sniper-sized positions, which is a separate decision; always start from a risk per trade you can accept.
FAQ about trade set-ups and sniper trading
What is a trade set-up?
A trade set-up is a plan made before you enter a trade. It covers the side (buy or sell), the entry, the take profit and the stop loss, with reasons from your analysis such as the trend and support and resistance on several timeframes. Once price meets the conditions, you look for the entry on a lower timeframe.
Why buy when H1 was in a downtrend?
Because the higher D1 timeframe was in an uptrend, H4 was ranging sideways and price had come down near the H4 orderblock support. The H1 drop was a pullback testing the H1 orderblock next to the H4 orderblock. Support from two timeframes stacked together, in the direction of the D1 trend, gave buys the edge.
What is an orderblock, and how is it different from a demand zone?
An orderblock is the last candle before price moves away strongly, treated as a zone with pending buy or sell orders. A demand zone usually covers the whole area where price paused before breaking up. An orderblock is therefore narrower and lets you place the stop loss closer. Read more in EP5 Demand and supply zones.
How is the 600%+ profit calculated?
From the trade history showing a total profit of $139.10 against a deposit of $20.34, about 684%. The profit came from several buy orders combined, not a single order, and applies to this case only; it doesn’t mean it can be repeated every time.
Why did the history close at about 147.109 instead of the 147.420 TP?
The orders were closed at about 147.107–147.115, before the planned TP, although the chart later reached the TP area. Closing before the TP is fine if you have clear rules, such as price nearing a supply zone or big news coming up, but set those rules in advance and apply them the same way every time.
Is sniper trading suitable for beginners?
Not really. Sniper trading means opening positions that are large compared with your account. If the plan is wrong and price hits the stop loss, you can lose almost everything in one go. Beginners should start by risking 1–2% per trade and read about the risks of this style in EP14 Sniper (All-in).
How does M5 RSI help with the entry?
Once the higher timeframes have set up a buy plan, use M5 RSI to wait for price to pull back until RSI nears the oversold area around 30, then buy for a better price and a tighter stop loss. Don’t trade M5 RSI on its own without a plan from the higher timeframes.
Read EP19 again Next lesson · EP21 What Is Forex Factory? A Beginner’s Guide to the Economic Calendar Time zone · impact colours · Actual / Forecast · news that moves gold
Read EP21 →
See all lessons in the free Forex and gold trading course
Risk warning: Trading Forex, gold and CFDs carries a high level of risk and you may lose all your money, especially with positions that are large compared with your account. 1TRADER provides information and education to support your own decisions only. The trade case in this article is for education; past results do not guarantee future results. Read the full risk disclosure.