
What Is Risk/Reward? Why It Matters, How to Calculate RR and Win Rate
Know how much you risk for how much profit before every trade, with a table of the win rate you need to break even and how to use RR to survive in the long run.
Quick summary before you read
- The risk/reward ratio (RR) compares the money you accept losing (SL) with the profit you expect (TP), e.g. risk $100 to aim for $300 = 1:3
- Break-even win rate = 1 ÷ (1 + R): 1:1 = 50% · 1:2 = 33.3% · 1:3 = 25% · 1:4 = 20%
- A good RR means you can profit without winning often, but the TP must sit at real support or resistance, not far away just to make the number look good
- Beginners should start with at least 1:2, always set the SL first and never move it to avoid a loss
What is the risk/reward ratio?
- Risk
- The money you accept losing on one trade, e.g. a stop loss at −$100
- Reward
- The money you expect to make on one trade, e.g. a take profit at +$300
- RR
- Risk divided by reward, e.g. 100 / 300 = 1:3: you risk 1 part to aim for 3 parts profit
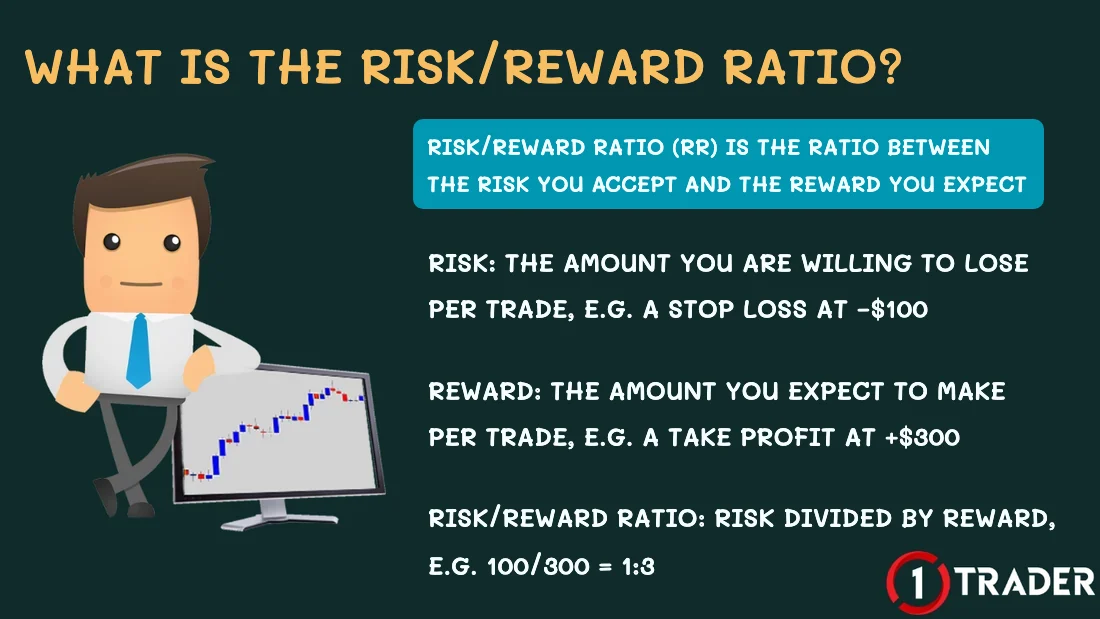
Two ways to write it: this article uses risk:reward (1:3), but some sources write reward:risk (3:1) or a single number; the Long/Short Position tool in TradingView (EP15) shows “3”. All of them mean the profit is 3 times the risk.
How to calculate risk/reward
Buy XAUUSD
Entry 4,150 · SL 4,140 · TP 4,180
At 0.01 lot (1 ounce of gold), a $1 move = $1
Buy EUR/USD
Entry 1.1650 · SL 1.1630 · TP 1.1690
At 0.1 lot you risk about $20 to make about $40
RR doesn’t depend on lot size, because a bigger lot increases profit and loss equally. Lot size controls what % of your account you can lose, as in EP9 Money management.
Why does risk/reward matter?
World-class traders take this seriously. Paul Tudor Jones has said he looks for 5-to-1 trades, risking $1 to make $5, so he can be wrong more often than right and still make money.
Risk/reward and break-even win rate
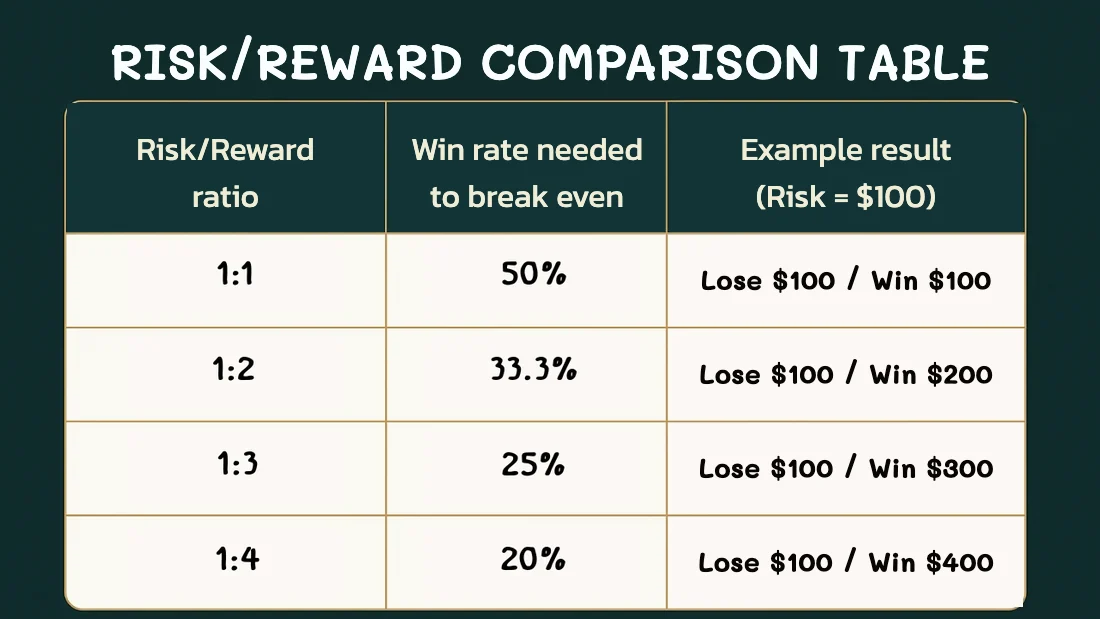
The higher the RR, the less often you need to win to make money. For example, with 5 trades at 1:4, losing the first 4 at $100 each costs −$400, but winning the 5th makes +$400 and brings you back to break even, matching the 20% break-even win rate (1 in 5).
Expectancy: look at both RR and win rate
40% wins · RR 1:2
Risking $100 each time → +$20 per trade on average, about +$2,000 over 100 trades
60% wins · RR 1:0.5
TP is half the SL → −$10 per trade on average, about −$1,000 over 100 trades
The figures above exclude spreads and commissions, which add a small cost to every trade, so the real win rate you need is slightly higher than the table. The more often you trade and the tighter your SL, the more these costs matter.
How to use risk/reward in practice
Cautions about risk/reward
Summary: the risk/reward ratio
| Risk/Reward | Break-even win rate | Example (risk $100) | Suits |
|---|---|---|---|
| 1:1 | 50% | Lose $100 / win $100 | Systems that win very often; little room for costs |
| 1:2 | 33.3% | Lose $100 / win $200 | The recommended minimum for beginners |
| 1:3 | 25% | Lose $100 / win $300 | Trend trading with entries at key zones |
| 1:4 | 20% | Lose $100 / win $400 | Precise entries from lower timeframes |
| 1:5 | 16.7% | Lose $100 / win $500 | Swing trades held longer, accepting frequent losses |
Risk/reward (RR) helps traders not just “survive” but profit in the long run, even with a modest win rate. Understanding it and applying it strictly, together with lot sizing and discipline, is what separates professionals from traders who fail.
FAQ about risk/reward
What is the risk/reward ratio?
The risk/reward ratio, or RR, compares the money you accept losing on one trade (the stop loss distance) with the profit you expect (the take profit distance). For example, an SL losing $100 and a TP making $300 gives a risk/reward of 1:3.
How do I calculate risk/reward?
Measure the distance from entry to stop loss as the risk and from entry to take profit as the reward, then divide risk by reward. For example, buying gold at 4,150 with SL 4,140 (risk 10) and TP 4,180 (reward 30) gives 10/30 = 1:3.
What is a good risk/reward?
Beginners should start with at least 1:2, because winning about 34% or more is then profitable (before costs). Don’t set an unrealistic TP just to get a high RR; place the TP at support, resistance or a zone price can actually reach.
What win rate do I need to break even?
The break-even win rate is 1 ÷ (1 + R): 50% for 1:1, 33.3% for 1:2, 25% for 1:3 and 20% for 1:4. These figures exclude spreads and commissions, so you need to win slightly more.
Is a higher RR always better?
Not always. The further the TP, the less likely price is to reach it, so the win rate falls. What matters is expectancy, which combines RR and win rate; for example, winning 40% at 1:2 averages +0.2R per trade.
Where do I see risk/reward in TradingView?
Use the Long Position or Short Position tool in the left toolbar and drag the entry, SL and TP. The tool shows the ratio as a single number, such as 3, meaning the reward is 3 times the risk, which is 1:3.
Can I take profit before the TP?
Yes, if you have rules set in advance, such as closing part at the first resistance. But if you always close early out of fear, your real RR will be lower than planned and a system that should profit can end up losing. Always record your actual results to review.
Read EP21 again Next · Free trading course See all lessons in the course Six stages, from chart basics to trade planning. More English lessons are coming soon.
View the course →
See all lessons in the free Forex and gold trading course
Risk warning: Trading Forex, gold and CFDs carries a high level of risk and you may lose money. A good risk/reward does not guarantee profit. 1TRADER provides information and education to support your own decisions only. Past results do not guarantee future results. Read the full risk disclosure.