
What Is a Pivot Point? Support and Resistance Formula and How to Trade It
Support and resistance you calculate instead of drawing, with the PP R1–R4 · S1–S4 formulas, a step-by-step gold example and how to use them for entries, SL and TP.
Quick summary before you read
- A pivot point (PP) is support and resistance calculated from yesterday’s high, low and close, so you don’t draw it; everyone using the same formula sees the same levels
- The core formula is PP = (H + L + C) ÷ 3, extended into resistance R1–R4 and support S1–S4
- With price above PP, look for buys; below PP, look for sells, using R1/R2 or S1/S2 as TP targets
- A pivot is not an entry signal: wait for a confirmation candle, trade with the trend and check risk/reward before every trade
What is a pivot point?
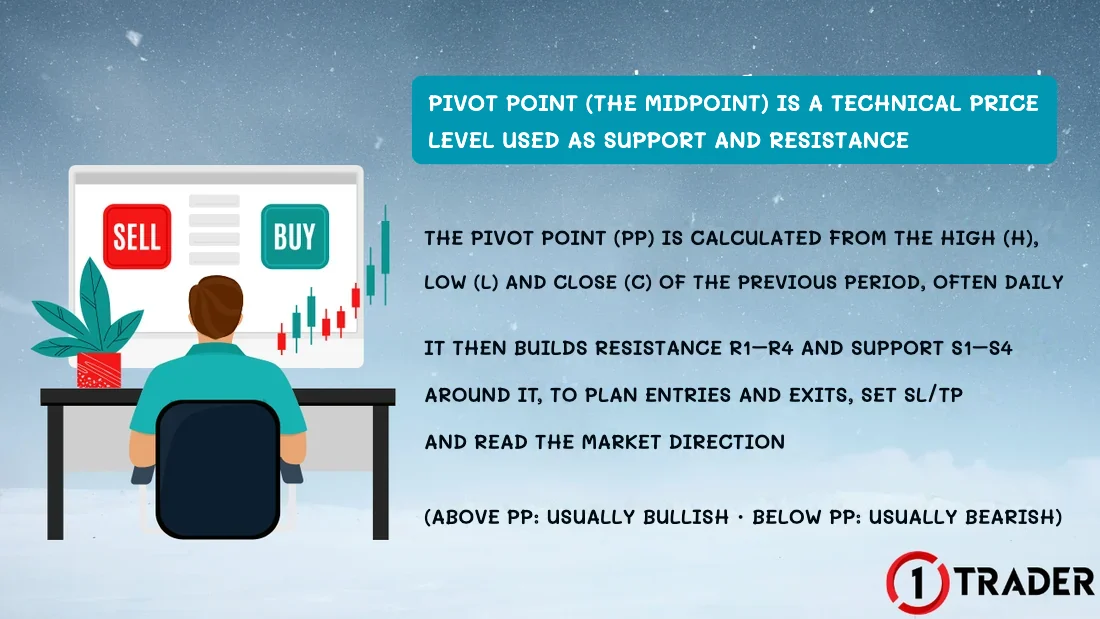
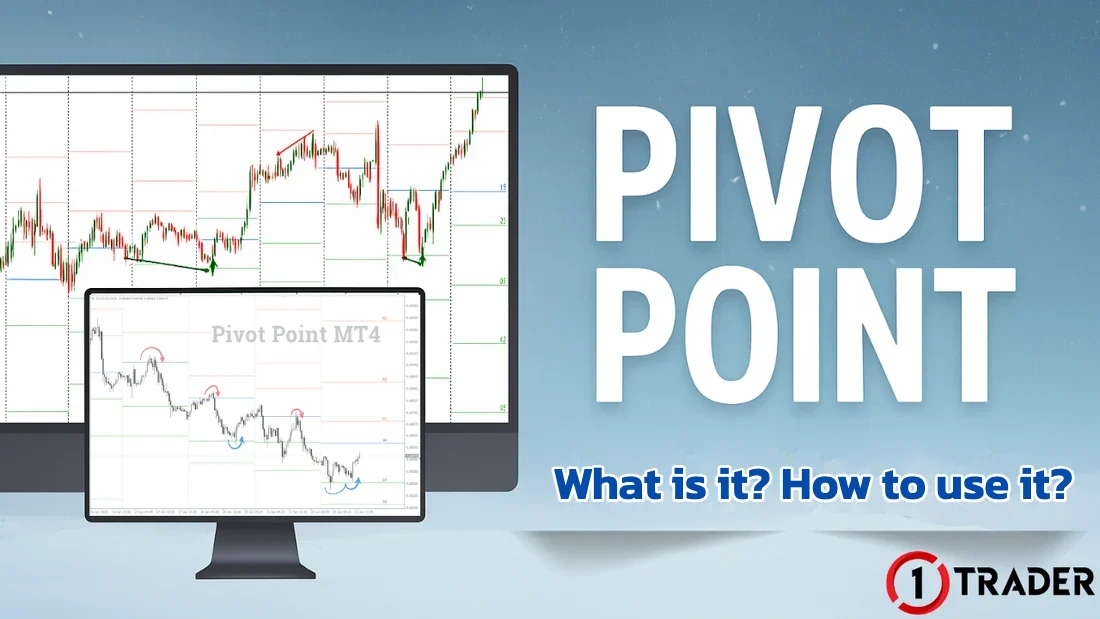
Besides the support and resistance you see and draw on the chart, such as trendlines, demand and supply zones, order blocks or FVGs, there are levels that come from mathematical calculation. The pivot point is one of them.
- PP
- The day’s midpoint. Price above PP is usually seen as bullish, below PP as bearish
- R1–R4
- Resistance levels above PP, from nearest to furthest
- S1–S4
- Support levels below PP, from nearest to furthest
- Strength
- Easy to calculate and “watched” by traders worldwide, so price often reacts around these lines
There are several pivot formulas: this article uses Classic. Others include Traditional (Floor), Fibonacci, Woodie, Camarilla and DeMark. Classic and Traditional share the same PP, R1, S1, R2 and S2, but R3/R4 and S3/S4 differ, so choose the matching type when you add an indicator.
The pivot point formula
First, take the values from the previous period (for daily pivots, yesterday’s candle).
- H
- The previous period’s high
- L
- The previous period’s low
- C
- The previous period’s close
- R
- The range = H − L
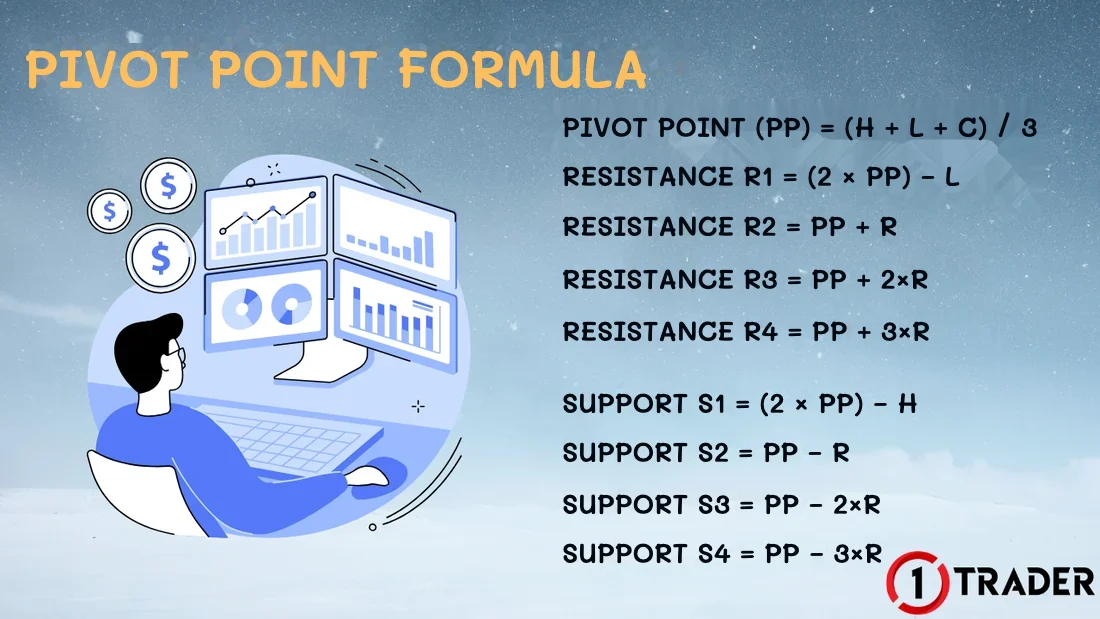
With Traditional pivots, R3 = 2×PP + (H − 2L) and S3 = 2×PP − (2H − L), which are narrower than Classic. PP, R1, R2, S1 and S2 use the same formulas.
Pivot calculation example: gold XAU/USD
To find the pivot point for 24 Sep 2025, use the H/L/C of the previous day, Tuesday 23 Sep 2025, for XAU/USD (spot): High 3,791.11 · Low 3,736.73 · Close 3,764.29
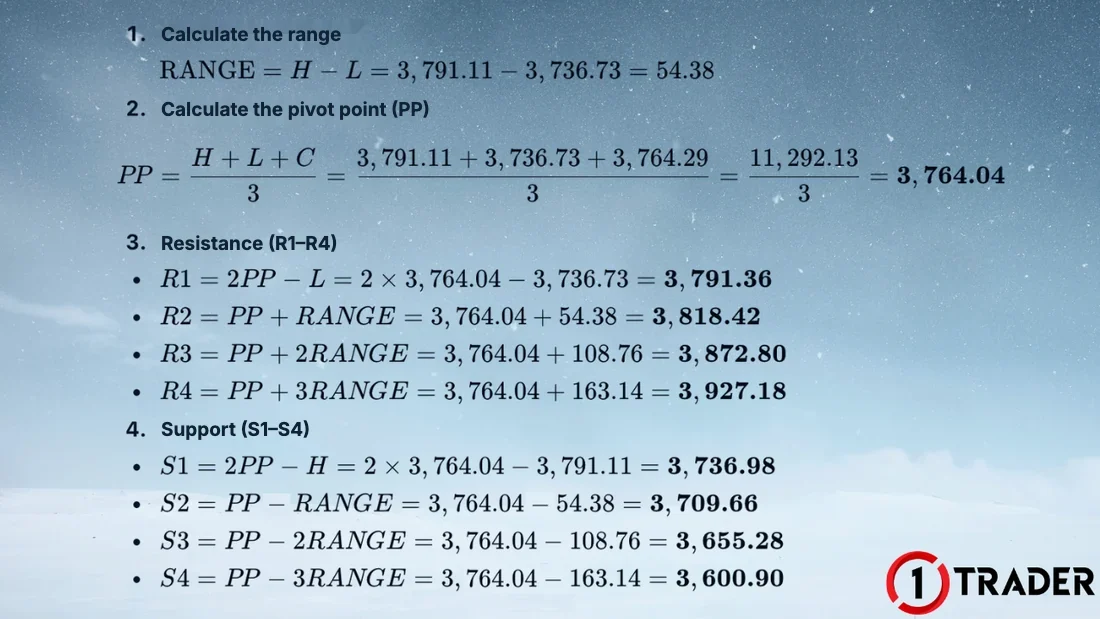
Notice that R1 (3,791.36) is close to yesterday’s high and S1 (3,736.98) close to yesterday’s low, while R3/R4 and S3/S4 are far away; price usually reaches them only on days with big news or a strong trend. Each broker’s figures may differ slightly because daily candles close at different times.
Indicators that calculate pivot points automatically
You can calculate them yourself, but you’d have to redo it every day. It’s easier to use an indicator that draws the lines automatically. There are 2 options.
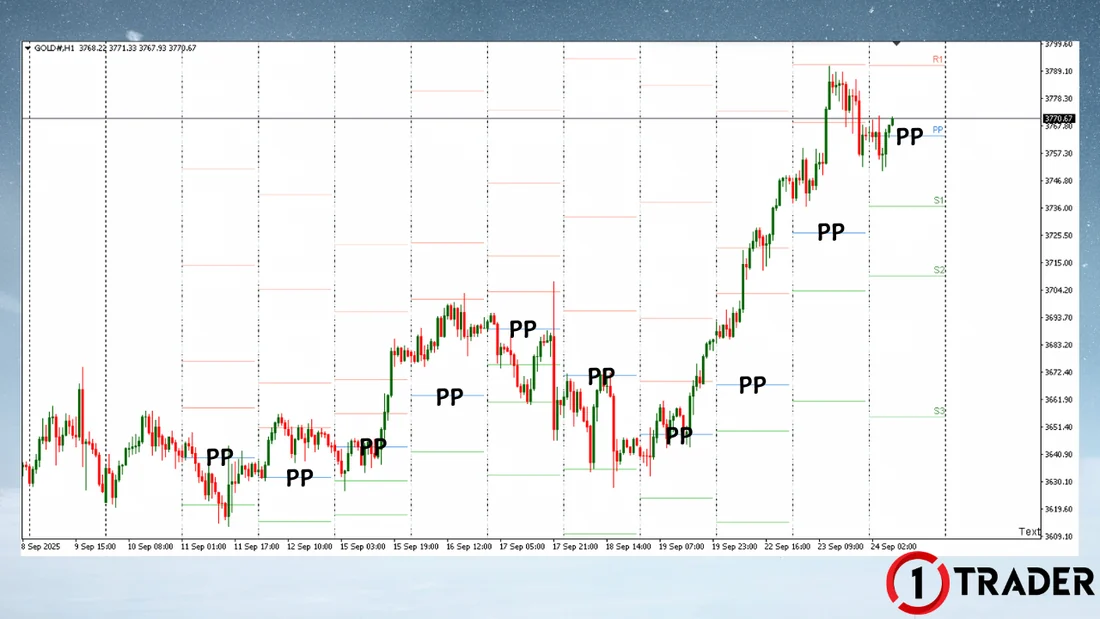
Reading the indicator in the chart
How to trade pivot points
Example: planning a buy at PP (hypothetical)
Using the levels for 24 Sep 2025 from section 03, suppose price opens above PP, pulls back to test PP at 3,764 and forms a bullish reversal candle, so you buy at 3,767.
SL below S1
The SL is too far compared with the distance to R1
SL below PP + swing low
The SL sits beyond the entry level; if PP breaks, the plan is wrong
A common suggestion is to “set the SL below S1 or above R1”, which suits entries at PP when you want to give price room, but always check the risk/reward (EP22). If you enter at S1, put the SL below S1 with a buffer or below the swing low, and size your lot as in EP9 Money management.
Cautions when using pivot points
Summary: pivot point levels
| Level | Formula (Classic) | XAUUSD example, 24 Sep 2025 | Use |
|---|---|---|---|
| R4 | PP + 3 × R | 3,927.18 | Extreme level; price rarely gets there |
| R3 | PP + 2 × R | 3,872.80 | Strong trend or big news days |
| R2 | PP + R | 3,818.42 | Second TP for buys |
| R1 | 2 × PP − L | 3,791.36 | First TP for buys · sell zone when price is below PP |
| PP | (H + L + C) ÷ 3 | 3,764.04 | The dividing line: above, look to buy; below, look to sell |
| S1 | 2 × PP − H | 3,736.98 | First TP for sells · buy zone when price is above PP |
| S2 | PP − R | 3,709.66 | Second TP for sells |
| S3 | PP − 2 × R | 3,655.28 | Strong trend or big news days |
| S4 | PP − 3 × R | 3,600.90 | Extreme level; price rarely gets there |
Pivot points are support and resistance that are easy to calculate and objective: everyone using the same formula sees the same lines, so they quickly frame each trading day. Use them as a “map” together with the trend and confirmation signals, not as entry signals on their own.
FAQ about pivot points
What is a pivot point?
A pivot point (PP) is a price level calculated from the high, low and close of the previous period, usually daily. It is used to build resistance R1–R4 and support S1–S4 for planning entries and exits, setting SL/TP and reading market direction.
What is the pivot point formula?
PP = (H + L + C) ÷ 3, R1 = 2×PP − L, S1 = 2×PP − H, R2 = PP + (H − L), S2 = PP − (H − L). Classic R3/R4 and S3/S4 are PP ± 2×(H − L) and PP ± 3×(H − L), where H, L and C are the previous day’s prices.
Which timeframe should I use pivot points on?
Daily pivots suit day trading on M5 to H1 charts. If you trade on H4, use weekly pivots, and if you hold for weeks on D1, use monthly pivots.
Why do pivot points differ between brokers?
Each broker’s daily candles open and close at different times based on server time, so yesterday’s high, low and close differ slightly. Most brokers close the daily candle at 17:00 New York time, about 21:00–22:00 GMT. If a broker has a Sunday candle, Monday’s pivots can also be off.
What is the difference between Classic and Traditional pivot points?
PP, R1, S1, R2 and S2 are calculated the same way; the difference is R3/R4 and S3/S4. Classic uses PP ± 2×range and ± 3×range, while Traditional uses R3 = 2×PP + (H − 2L) and S3 = 2×PP − (2H − L). There are also Fibonacci, Woodie, Camarilla and DeMark pivots.
How do I use pivot points in TradingView?
Click Indicators and search for Pivot Points Standard, a free built-in indicator. In the settings, set Type to Classic to match the formula in this article and Pivots Timeframe to Daily (1D) for day trading.
Can I trade with pivot points alone?
You shouldn’t. Pivots only show the levels many traders watch, not whether price will bounce or break. Wait for confirmation such as a reversal candle or divergence, combine them with the trend, trendlines, EMA or RSI, and check risk/reward before every trade.
Read EP22 again Next lesson · EP24 What Is the EMA? Using the Moving Average to Read Trends and Find Entries EMA formula · EMA vs SMA · Golden Cross · TradingView/MT4 settings
Read EP24 →
See all lessons in the free Forex and gold trading course
Risk warning: Trading Forex, gold and CFDs carries a high level of risk and you may lose money. Pivot point support and resistance do not guarantee that price will reverse. 1TRADER provides information and education to support your own decisions only. Past results do not guarantee future results. Read the full risk disclosure.