
What Is the EMA? Using the Moving Average to Read Trends and Find Entries
The moving average that follows price fastest, with the formula, how EMA differs from SMA and 3 ways to use it: trend · support and resistance · crossovers
Quick summary before you read
- The EMA is a moving average that gives more weight to recent prices, so it follows price faster than the SMA but also gives more false signals
- Formula: EMA = close × k + yesterday’s EMA × (1 − k), where k = 2 ÷ (n + 1); for EMA 10, k ≈ 0.18
- 3 uses: reading the trend · dynamic support and resistance · crossovers (Golden Cross / Death Cross)
- It works best in trending markets; in sideways markets the lines cross back and forth and give false signals, so combine it with price structure
What is the EMA?
The moving average is a basic tool traders use to read price direction in every market: stocks, Forex, gold and crypto. A very popular type is the EMA, because it follows price faster than the SMA.
- EMA
- An average that weights the latest price most, with the weight shrinking exponentially for older prices
- SMA
- A simple average where every candle has equal weight, e.g. SMA 10 = sum of 10 closes ÷ 10
- Period (n)
- The number of candles used, e.g. EMA 20 on H1 covers the last 20 hours, on D1 the last 20 days
The period is a number of candles, not always days: EMA 20 on M15 is twenty 15-minute candles (5 hours), so the same EMA setting looks different on each timeframe.
The EMA formula
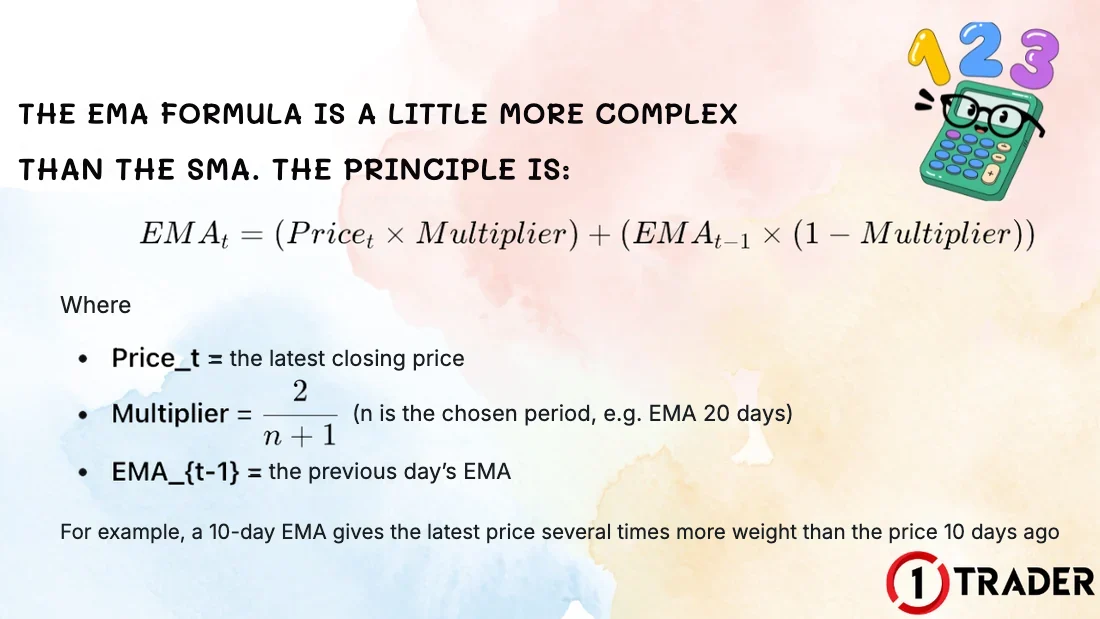
The EMA formula is a little more complex than the SMA, because each value builds on the previous candle’s EMA.
- Close
- The latest candle’s closing price (Pricet)
- k
- The multiplier = 2 ÷ (n + 1), e.g. EMA 10 → 2 ÷ 11 ≈ 0.1818
- EMAt−1
- The previous candle’s EMA; the very first value usually starts from the SMA of the first n candles
EMA 10 on gold
Yesterday’s EMA 10 = 4,100 · today’s close = 4,150
Price is 50 points above the old EMA, so the line moves up 18% of the gap (+9.09)
EMA 10 vs SMA 10
The EMA weights the latest price about 7 times more than the price 10 candles ago
In practice you don’t calculate it yourself; platforms like TradingView and MT4 do it automatically. Understanding the formula simply shows why the EMA is faster than the SMA.
EMA pros and cons
3 ways to trade with the EMA
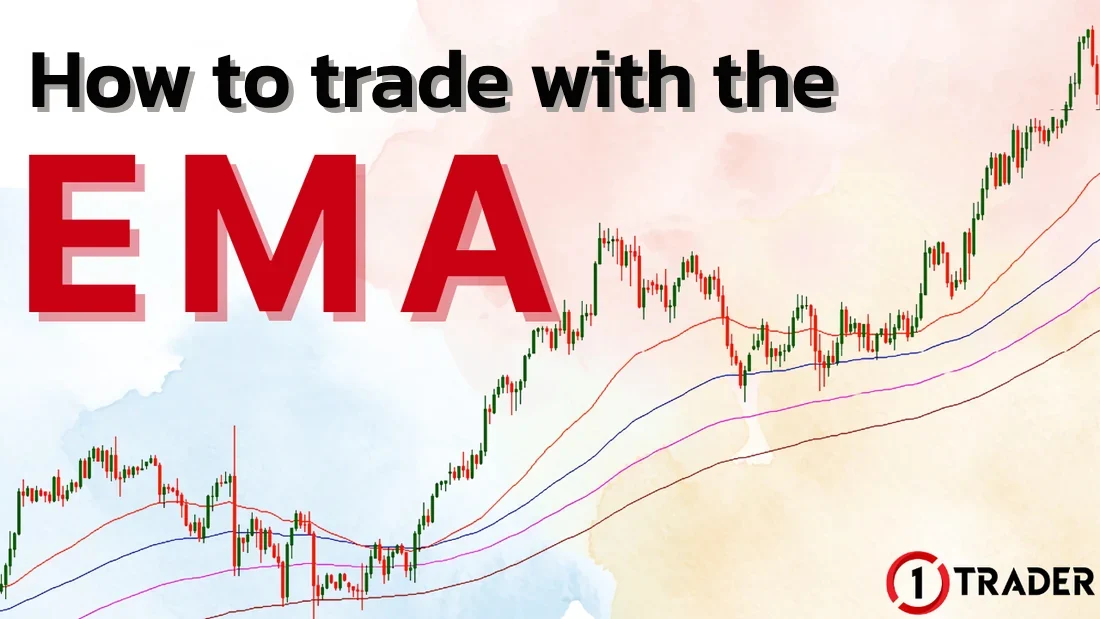
1. Read the trend with the EMA
Short EMAs (such as EMA 10 or 20) show the short-term trend, while long EMAs (such as EMA 50 or 200) show the market’s bigger trend. If price is above the line but the line is still flat, treat the market as having no clear trend and check the high–low structure as in EP1 Trends.
2. Use the EMA as dynamic support and resistance
Treat the EMA as a zone, not an exact line. Price may poke through slightly before bouncing, so wait for a confirmation candle and put the stop loss below the latest swing low, not right under the EMA.
3. Use EMA crossovers as signals
Golden Cross
Confirms the trend has turned up; look for buys
Death Cross
Confirms the trend has turned down; look for sells
Standard pairs: EMA 50 and 150 also work, but the Golden Cross / Death Cross the market usually refers to uses 50 and 200. Day traders prefer shorter pairs such as EMA 9/21 or 20/50. Crossovers happen after price has already started moving, so use them to confirm the trend rather than as precise entries.
EMA settings in TradingView and MT4
Cautions when using the EMA
Summary: popular EMA settings
| EMA | Term | What it shows | Best for |
|---|---|---|---|
| EMA 9–10 | Very short | Momentum of the latest price | Scalping, timing entries on M1–M15 |
| EMA 20–21 | Short | Short-term trend and pullbacks | Day trading on M15–H1 |
| EMA 50 | Medium | Medium-term trend, dynamic support and resistance | Swing trading on H1–H4 |
| EMA 100 | Medium–long | Stronger support and resistance | Holding several days on H4–D1 |
| EMA 200 | Long | The big trend, the line between bull and bear markets | Every style, as a direction filter before trading |
The EMA is a key tool for understanding the trend and finding better entries and exits, but don’t use it alone. Combine it with other analysis such as Dow Theory, price action or other indicators to improve accuracy and reduce mistakes.
FAQ about the EMA
What is the EMA?
The EMA (exponential moving average) is a moving average that gives more weight to recent prices than to older ones, so it reacts to price changes faster than the SMA. It is used to read the trend, as dynamic support and resistance, and for crossover signals.
How is the EMA different from the SMA?
The SMA weights every candle equally; in SMA 10 each candle counts 10%. EMA 10 gives the latest candle about 18% and less to each older one, so the EMA turns with price sooner but gives false signals more often than the SMA.
What EMA settings should I use?
There is no single best setting. Popular choices are EMA 9–10 and 20–21 for the short-term trend, EMA 50 for the medium term and EMA 200 for the big trend. Pick 2–3 lines and stick with the same settings.
What are the Golden Cross and Death Cross?
A Golden Cross is when a short moving average crosses above a long one, a bullish signal. A Death Cross is when the short average crosses below the long one, a bearish signal. The standard version uses the 50 and 200 lines, and crossovers usually come later than the actual turning point.
Which timeframe is best for trading gold with the EMA?
It works on every timeframe. Check EMA 50 and 200 on H4 or D1 for the big trend first, then use EMA 20 on M15 to H1 to time entries when price pulls back to the line, following multi-timeframe analysis.
Why does the EMA give so many false signals?
Because the EMA is sensitive to the latest price. When the market moves sideways, price and the EMA cross back and forth many times (whipsaw). Use the EMA when there is a clear trend, watch the slope, and be extra careful when the line is flat.
How do I set up the EMA in TradingView?
Click Indicators and search for Moving Average Exponential, set Length, e.g. 20, and Source to close. For more lines, add the indicator again and change the Length. In MT4, use Moving Average and set MA method to Exponential.
Read EP23 again Next lesson · EP25 What Is a Trading Session? Forex Market Hours and the Best Times to Trade 4 sessions in GMT · overlaps · summer/winter time · gold trading hours
Read EP25 →
See all lessons in the free Forex and gold trading course
Risk warning: Trading Forex, gold and CFDs carries a high level of risk and you may lose money. EMA signals do not guarantee profits. 1TRADER provides information and education to support your own decisions only. Past results do not guarantee future results. Read the full risk disclosure.