
The Truth About Support and Resistance: Why Price Breaks or Bounces and How to Find Entries
The chart isn’t tricking you; it reflects what the whole market believes. Understand why support and resistance come in many layers and use divergence to spot pressure building before the chart moves
Quick summary before you read
- The chart isn’t tricking anyone; it reflects the beliefs and orders of the whole market
- Support and resistance come in many overlapping types: old highs/lows, EMA, FIBO, demand/supply, order blocks, FVG, trendlines. No one knows for sure which level will hold or break
- Use divergence at support and resistance as a sign of pressure building before the chart moves, then wait for confirmation before entering
- Put the SL below the support where the divergence formed and split your TP across the next resistance levels, moving the SL to breakeven
Why does the chart seem to “trick” you?
Many beginners know this feeling: you check every indicator and draw your support and resistance carefully, but as soon as you enter, price runs the other way, and it feels like the chart is tricking you.

- Price
- The result of the battle between buyers and sellers at that moment
- Support
- A zone where many traders are ready to buy, so it often stops price falling
- Resistance
- A zone where many traders are ready to sell, so it often stops price rising
- No one controls it
- No single person controls the market, and no one knows for sure whether price will bounce or break
- What you can do
- Assess the probabilities and plan for both outcomes
- The goal
- Move from “guessing the future” to trading a reasoned plan
Support and resistance come in layers
Support and resistance are like “a battlefield of beliefs”. Some traders watch old highs and lows, some the EMA or Fibonacci, others demand/supply zones, order blocks, FVGs or trendlines. Every one of these tools can act as support or resistance.
Because everyone believes something different, the chart has many overlapping layers of support and resistance. The market doesn’t only have the level you trust; it has countless levels other traders trust. So you can never know which level will stop price and which will be broken.
Spotting pressure building with divergence
Since you can’t know which level will hold or break, what you can do is look for clues the market leaves behind. One useful clue is a conflict, or divergence, between price and an indicator such as RSI.
- Divergence
- Price moves one way while the indicator (e.g. RSI) moves the other way
- Meaning
- The current side is weakening while the other side starts building pressure
- What often follows
- Price may “pause or reverse”, but divergence doesn’t tell you how far
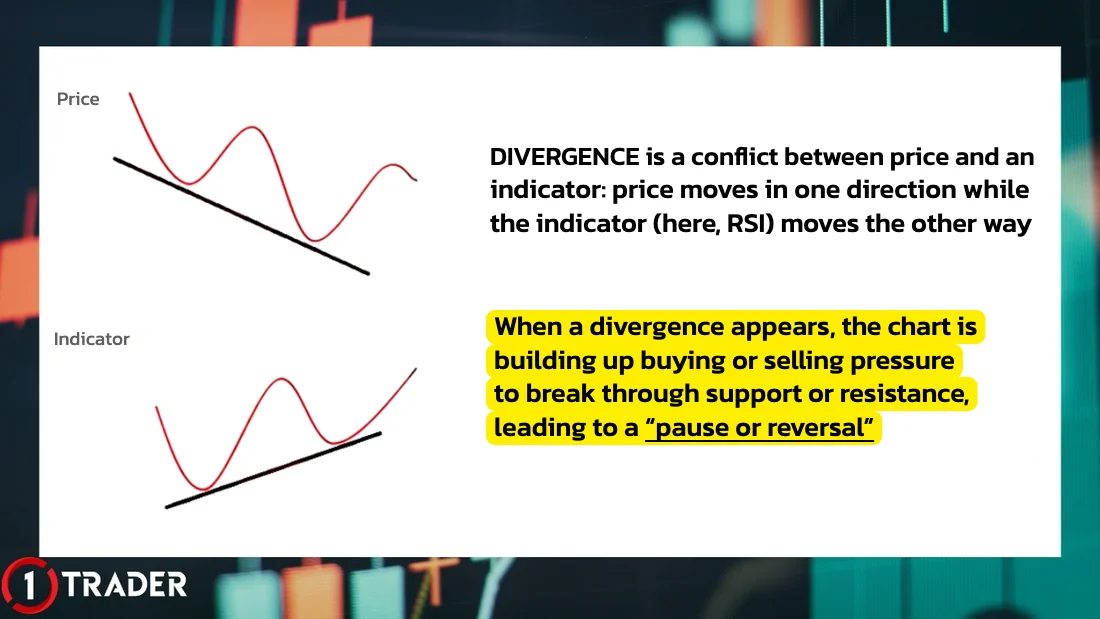
You can never know in advance whether a divergence will lead to just a pause or a reversal; you only know the market is building pressure and will likely move soon. Review classic and hidden divergence in EP7 Divergence, and use the free divergence indicator (EP18) to draw the lines automatically.
Using divergence for entries, SL and TP
A divergence at support marks where pressure built up before the chart moved, so it can serve as a low-risk entry: put the SL below the support where pressure built up and split the TP across the next resistance levels.
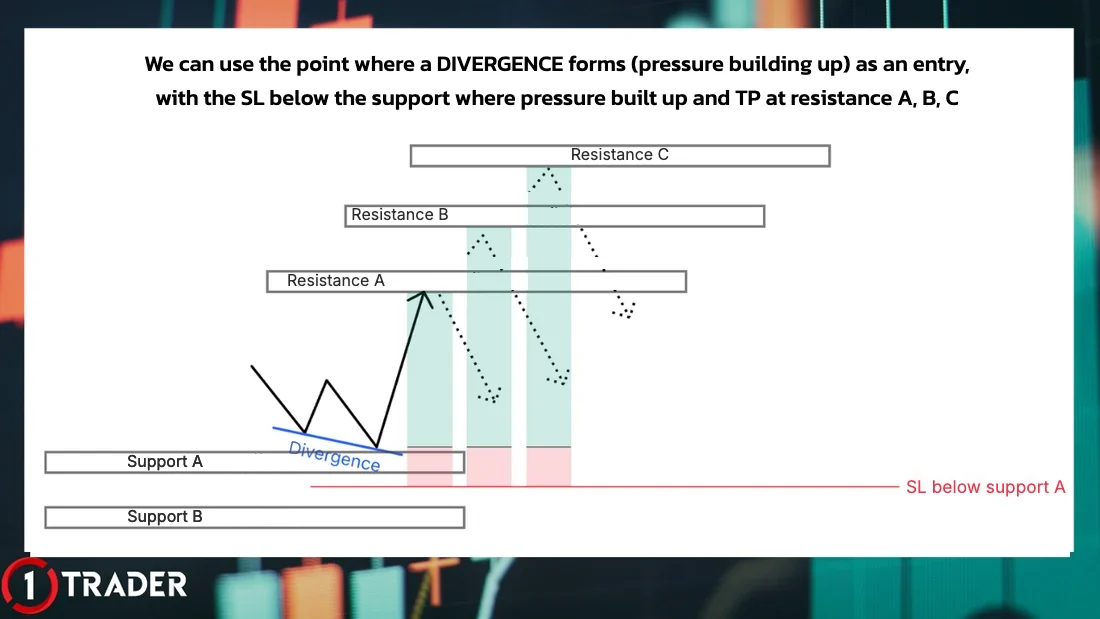
Example: planning a gold buy (hypothetical numbers)
Buy after confirmation
TP A 4,040 (+28) · TP B 4,066 (+54) · TP C 4,102 (+90)
50% · 30% · 20%
If every target is hit, the average gain is +48.2 on 18 of risk · if only A is hit and price returns to breakeven, you still make +14
You don’t know which resistance the built-up pressure will carry price to, so with distant TPs always take partial profits or move to breakeven. Check the plan with risk/reward (EP22) and size your lot as in EP9 Money management. For sells, do the reverse: wait for bearish divergence at resistance, put the SL above resistance and the TP at the next support.
Cautions when trading support and resistance
Summary: the truth about support and resistance
| Topic | Common belief | The truth | What to do |
|---|---|---|---|
| The chart tricks you | Someone moves the chart against you | Price is the sum of the whole market’s beliefs | Think in probabilities and plan for both outcomes |
| Number of levels | There is only one correct level | Many levels overlap, depending on each trader’s tools | Find zones where several tools overlap on a higher timeframe |
| Shape of a level | An exact price line | A zone; price may overshoot slightly | Mark a range and put the SL outside the zone |
| Divergence | It guarantees a reversal | It shows pressure building; price may pause or reverse | Use it at key levels and wait for confirmation |
| TP | One distant target | No one knows how far the move will go | Split TP across targets and move the SL to breakeven |
The chart doesn’t lie; it simply reflects what the whole world believes, in the form of price
Once you understand that support and resistance come from people’s beliefs, you stop trading to “guess the future” and start trading a plan: use divergence to find signs of pressure building, put the SL below the support where the signal formed and split the TP across resistance levels. That gives you a clear plan with worthwhile risk/reward.
FAQ about support and resistance
What are support and resistance?
Support is a price zone with enough buying to stop price falling; resistance is a zone with enough selling to stop price rising. They come from the beliefs and orders of many traders, so treat them as zones, not exact lines.
Why does price break the levels I draw?
Because the market has many overlapping types of support and resistance: old highs and lows, EMA, Fibonacci, demand/supply, order blocks, FVG, trendlines and pivot points. Each trader trusts a different level. Yours may not be the one most traders use, or the other side may have built up enough pressure to break through.
How do I know which support or resistance is strong?
No one knows for sure, but levels with weight usually have several tools overlapping (confluence), sit on a higher timeframe, have clearly held several times and agree with the main trend. Think in probabilities and plan for both a bounce and a break.
How does divergence relate to support and resistance?
Divergence is when price and an indicator such as RSI move in opposite directions. At a key support or resistance level, it suggests the current side is weakening and price may pause or reverse. It shows pressure building before the chart moves, but not how far price will go.
How do I set the SL and TP when trading divergence at support?
For a buy, put the SL below the support where the divergence formed, with a buffer, and split the TP across the next resistance levels: close part at resistance A, move the SL to breakeven and hold the rest for resistance B and C. For a sell, do the reverse.
Does divergence work every time?
No. Divergence can form several times while price keeps going, especially in strong trends or around news. Wait for confirmation such as a reversal candle or a break of a minor high, and use it at support and resistance levels that carry weight on a higher timeframe.
What happens to support after it breaks?
Support that breaks clearly often becomes resistance, and broken resistance often becomes support (role reversal). That’s why many traders wait for price to come back and retest the level before trading in the direction of the break.
Read EP25 again Next lesson · EP27 The Best SMC Indicator on TradingView: LuxAlgo Smart Money Concepts BOS · CHoCH · order blocks · FVG · EQH/EQL, free on TradingView
Read EP27 →
See all lessons in the free Forex and gold trading course
Risk warning: Trading Forex, gold and CFDs carries a high level of risk and you may lose money. Support, resistance and divergence signals do not guarantee that price will bounce or reverse. 1TRADER provides information and education to support your own decisions only. Past results do not guarantee future results. Read the full risk disclosure.