
What Is MACD? How to Use It: 3 Ways to Find Entries
The MACD line, signal line and histogram, what 12, 26, 9 means, how to read crossovers, the zero line and divergence, plus the pros and cons to know before you use it for real.
Quick summary before you read
- MACD = EMA 12 − EMA 26, used to read the trend direction and price momentum
- It has 3 parts: MACD line · signal line · histogram, with standard settings of 12, 26, 9
- 3 ways to use it: crossovers for entry timing · the zero line for momentum · divergence to warn of reversals
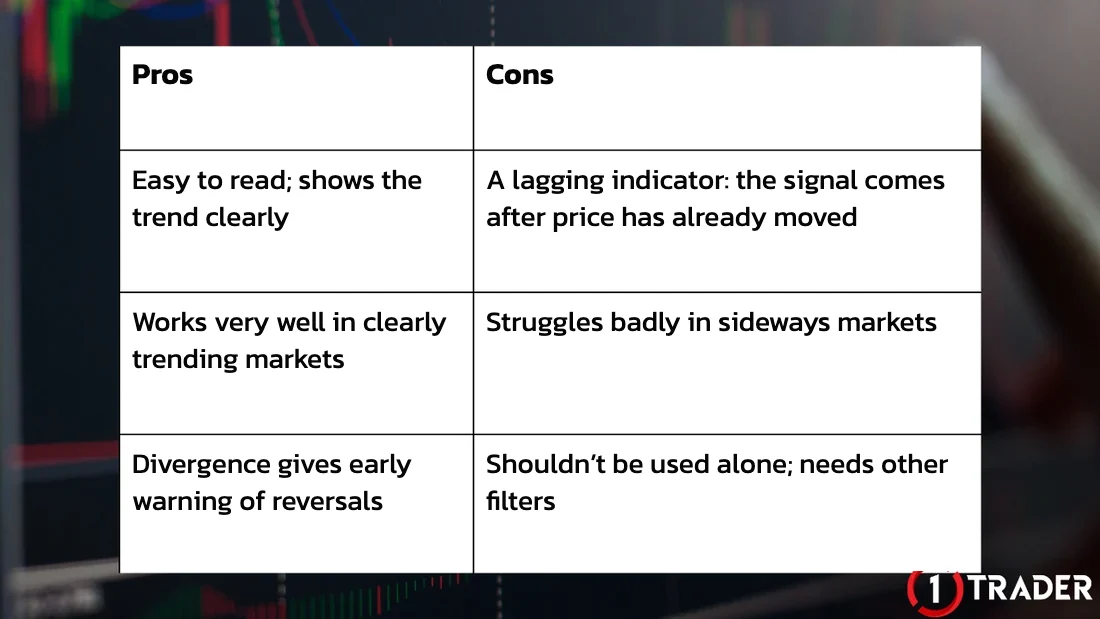
- It is a lagging indicator that gives many false signals in sideways markets, so combine it with the trend and support and resistance
What is MACD?
MACD is a very popular technical tool in Forex and gold because it does several jobs: it shows the direction and strength of the trend, the momentum of price, the timing of entries and exits, and early warnings of reversals.
Unlike RSI (EP17) or Stochastic (EP11), which move within 0–100, MACD has no upper or lower limit; its value depends on the asset’s price, so there are no fixed overbought/oversold levels. Look at the line crossovers, the position relative to the zero line and the direction instead. If you don’t know the EMA yet, read What is the EMA (EP24) first.
The parts of MACD
MACD has 3 main parts, shown in a separate window under the price chart.
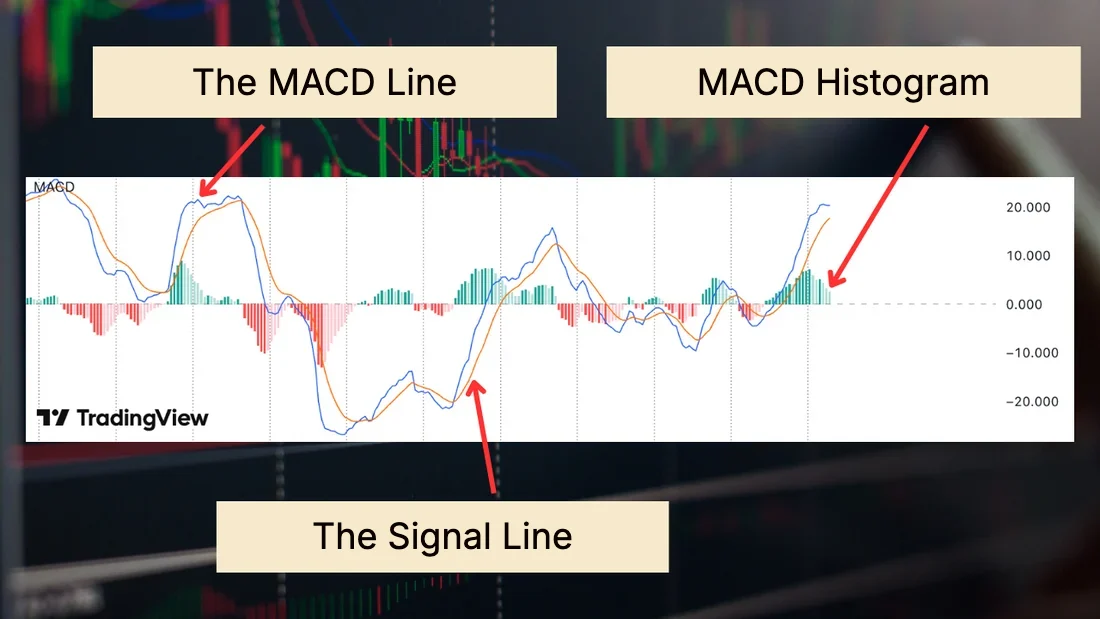
The faster-moving line, made by subtracting one EMA from anotherEMA(12) − EMA(26)
A further average of the MACD line that smooths it, giving signals when it crosses the MACD lineEMA(9) of MACD
The gap between the two lines: the further apart they are, the longer the bars; when they cross, the bar is 0MACD − Signal
If you use MT4/MT5: the standard MACD in MT4/MT5 draws the MACD line as bars and the signal line as a dotted line calculated with an SMA, so there is no difference histogram like TradingView’s. The bars you see in MT4 are the MACD line itself, not MACD − Signal. Colours can also differ between platforms, so don’t rely on colour. See how to use TradingView in EP15.
The standard 12, 26, 9 settings
When you add MACD in MT4, MT5 or TradingView, the default settings, and the ones traders around the world use most, are 12, 26, 9.
- 12 · Fast EMA
- A 12-candle EMA that reacts quickly to price
- 26 · Slow EMA
- A 26-candle EMA that reacts more slowly
- 9 · Signal
- The MACD averaged over 9 candles to create the signal line (TradingView uses an EMA, MT4/MT5 an SMA)
Calculating the MACD line
Calculating the histogram
Tip: beginners should start with the standard settings, because most people use them and it is easy to compare signals with other analysis and examples. Lower values make signals faster and more frequent but with more false ones; higher values make them slower but filter more. If you change them, backtest (EP10) on the asset and timeframe you actually trade first.
How to use MACD: 3 methods in detail
There are 3 main ways to read MACD, from basic to advanced.
1. Crossovers · the basic signal
The simplest and most popular method, used as an entry trigger.
Caution: in a sideways market the lines cross back and forth often and give false signals, which can lead to repeated losses, so combine them with the higher-timeframe trend and support and resistance. Some sources call this upward cross a golden cross, but in these lessons a golden cross means EMA 50 crossing EMA 200, as in EP24, so we say bullish/bearish crossover to avoid confusion.
2. Zero line cross · reading momentum
The centre line of MACD is the 0 level. Because MACD = EMA 12 − EMA 26, the MACD line crossing 0 is the same as EMA 12 crossing EMA 26 on the price chart.
- Bullish momentum
- The MACD line holds above 0 = EMA 12 is above EMA 26; look mainly for buys
- Bearish momentum
- The MACD line is below 0 = EMA 12 is below EMA 26; look mainly for sells
The histogram shows short-term momentum: bars above 0 mean the MACD line is above the signal line. Bars that keep getting longer mean momentum is building; bars that start to shrink mean it is fading, which often shows before the lines actually cross.
3. Divergence · the advanced signal
MACD’s standout use: spotting price “reversal points” when price and MACD move in opposite directions.
Divergence says momentum is starting to fade; it doesn’t mean price will reverse right away. In a strong trend, divergence can appear several times before a real reversal. See how to tell classic from hidden divergence in EP7, and an indicator that draws divergence automatically (with MACD support) in EP18.
Pros and cons of MACD
Summary and an easy rule of thumb
MACD is a powerful tool once you understand how it behaves. The key is never to decide on MACD alone: combine it with price action, support and resistance (EP26) and the higher-timeframe trend, as in Multi-Timeframe (EP19), to filter out false signals.
| Method | What it shows | Buy side | Sell side |
|---|---|---|---|
| Histogram | Momentum | Positive bars getting longer | Negative bars getting longer |
| Zero Line | Momentum direction | MACD line above 0 | MACD line below 0 |
| Crossover | Entry trigger | MACD crosses above Signal | MACD crosses below Signal |
| Divergence | Reversal warning | Price lower low, MACD higher low | Price higher high, MACD lower high |
Histogram for momentum · crossovers for entries · divergence to watch for reversals
Before using real money, test MACD signals on historical charts and a demo account, always place a stop loss, and size your lot as in Money Management (EP9), making sure the risk/reward (EP22) is worth it.
Frequently asked questions about MACD
What is MACD?
MACD (Moving Average Convergence Divergence) is a trend-following momentum indicator developed by Gerald Appel in the late 1970s. It is calculated from the difference between EMA 12 and EMA 26 and is used to read the trend direction, price momentum and entry and exit timing.
What are the standard MACD settings?
The standard settings are 12, 26, 9: a 12-candle fast EMA, a 26-candle slow EMA and a signal line that averages MACD over 9 candles. Beginners should start with these, because most people use them and there are the most examples to learn from.
What does MACD crossing above the signal line mean?
MACD crossing above the signal line is a bullish momentum signal (bullish crossover) used to consider buying, while crossing below is a bearish crossover used to consider selling. In sideways markets this signal is often false, so combine it with the trend and support and resistance.
What does the MACD zero line tell you?
When the MACD line is above 0, EMA 12 is above EMA 26 and momentum is bullish; below 0, momentum is bearish. So the MACD line crossing 0 is the same as EMA 12 crossing EMA 26.
How do you read the MACD histogram?
The histogram is the difference between the MACD line and the signal line. Bars above 0 mean MACD is above the signal line; longer bars mean momentum is building, shorter bars mean it is fading, and the bar is 0 when the two lines cross.
Is MACD different in MT4 and TradingView?
Yes. TradingView shows the MACD line, signal line and histogram, and uses an EMA for the signal line. The standard MACD in MT4/MT5 shows the MACD line as bars and the signal line as a dotted SMA line, so there is no difference histogram, and the values may differ slightly.
Can I trade with MACD alone?
You shouldn’t. MACD is a lagging indicator and gives many false signals in sideways markets. Combine it with the higher-timeframe trend, support and resistance or price action, and always set a stop loss.
Read EP31 again Next lesson · EP33 Day Trading Plan: How to Plan and Find Entries in Gold Market structure · SL/TP on H1 · M5–M15 divergence
Read EP33 →
See all lessons in the free Forex and gold trading course
Risk warning: Trading leveraged Forex, gold and CFDs carries a high level of risk and you may lose all the money you invest. No indicator guarantees profits. The numbers in this article are examples for education. 1TRADER is a partner (IB) of some brokers and provides information to support your own decisions only. Read the full risk disclosure.