
Day Trading Plan: How to Plan and Find Entries in Gold
Plan before the market every day in 3 steps: read the D1–H1 trend · mark support and resistance · set SL/TP on H1, then time your entry with M5–M15 divergence, with a real gold sell-plan example.
Quick summary before you read
- In day trading, the plan and discipline matter more than how accurate your signals are
- Plan in 3 steps: read the D1–H1 trend → mark support and resistance → set SL/TP on H1
- Find entries with M5–M15 divergence that matches your plan and forms at key resistance/support only
- Real gold example, 2 December 2025: sell plan, SL 4,245, TP 4,186, RR 1.21
Why day trading needs a trade plan

In day trading, the most important thing is not how accurate your entry signals are, but a clear “trade plan” and the discipline to follow it. Day traders face high intraday volatility, and rushed decisions without a plan usually lead to more losses than profits.
This article has 2 parts: analysing the chart to build the plan (D1–H1) and finding entries with divergence signals (M5–M15). It uses the same top-down approach as Multi-Timeframe (EP19) and the day-trading timeframe pair from EP30.
Step 1: read the market structure
The first step in planning is to work out which trend the market is in. Start from the higher timeframe, D1, then down to H4 and H1 to see the big picture before the details.
Look mainly for buys; wait for price to pull back to support
Look mainly for sells; wait for price to bounce up to resistance
Wait for a breakout or trade the edges carefully, with a smaller lot
Review how to identify trends in Trends (EP1), Sideways markets (EP2) and Trend reversals (EP3). If the timeframes disagree, be clear which trend you are following and which you are trading against, so you set a suitable TP.
Step 2: mark the support and resistance price is watching
Reversals and strong moves usually happen around key support and resistance. Knowing which zones carry weight tells you where to focus when looking for entries on the smaller timeframe.
The most reliable zones are where several tools overlap on a higher timeframe, such as an H4 supply zone that lines up with a FIBO level and a previous high. Support and resistance are zones, not exact lines; read more in The truth about support and resistance (EP26).
Step 3: set the trade plan on the H1 timeframe
Once you know the trend and the support and resistance on each timeframe, bring it all together into a plan on H1, the main timeframe most day traders use, with 4 things: side · SL · TP · RR.
Example gold trade plan, 2 December 2025
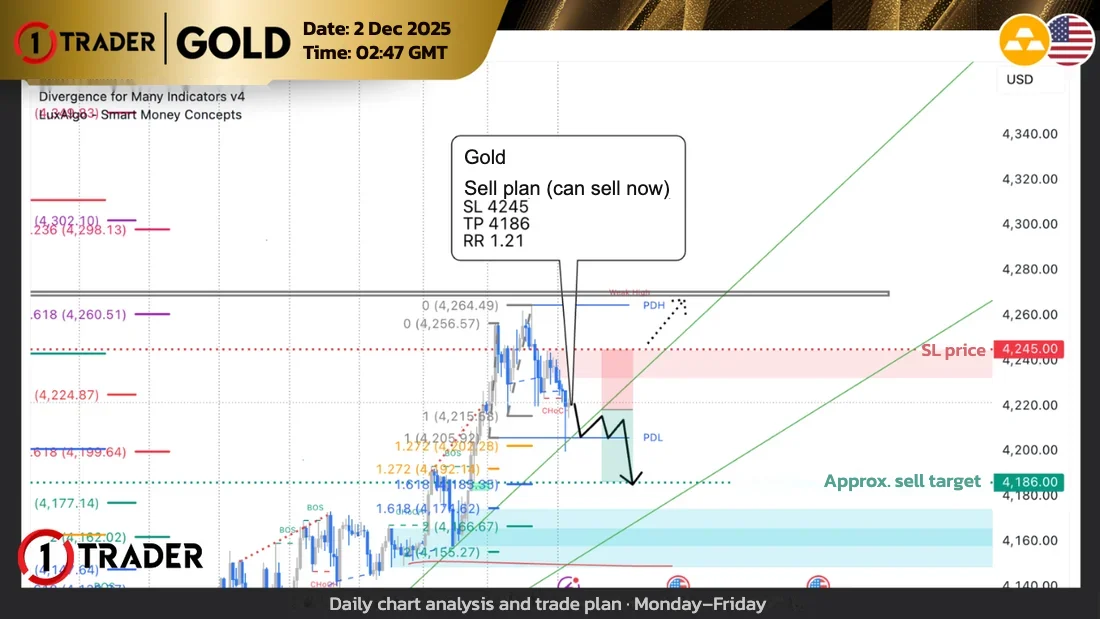
- Side
- Sell with the H1 trend
- SL
- 4,245 (above the H1 downtrend swing high)
- TP
- 4,186 (next support)
- RR
- ≈ 1.21
- Cancel the plan
- If price closes above 4,245
Risk distance vs reward distance
Gold lot size
This plan trades against the bigger D1/H4 trend, so the TP is set at nearby support and the RR is modest. Stick strictly to the SL. See how to work out RR in Risk/Reward (EP22) and calculate the lot with the trading journal (EP28). You now have a plan but no entry yet; the next step is to look for a signal on M5–M15.
Find entries with M5–M15 divergence
Once you know which side you will trade that day, open an M5 or M15 chart in TradingView, add the Divergence for Many Indicators v4 indicator and look only for divergence signals that match your plan: with a sell plan, only sell-side divergence. See how to install it in Free divergence indicator (EP18) and the basics in What is divergence (EP7).
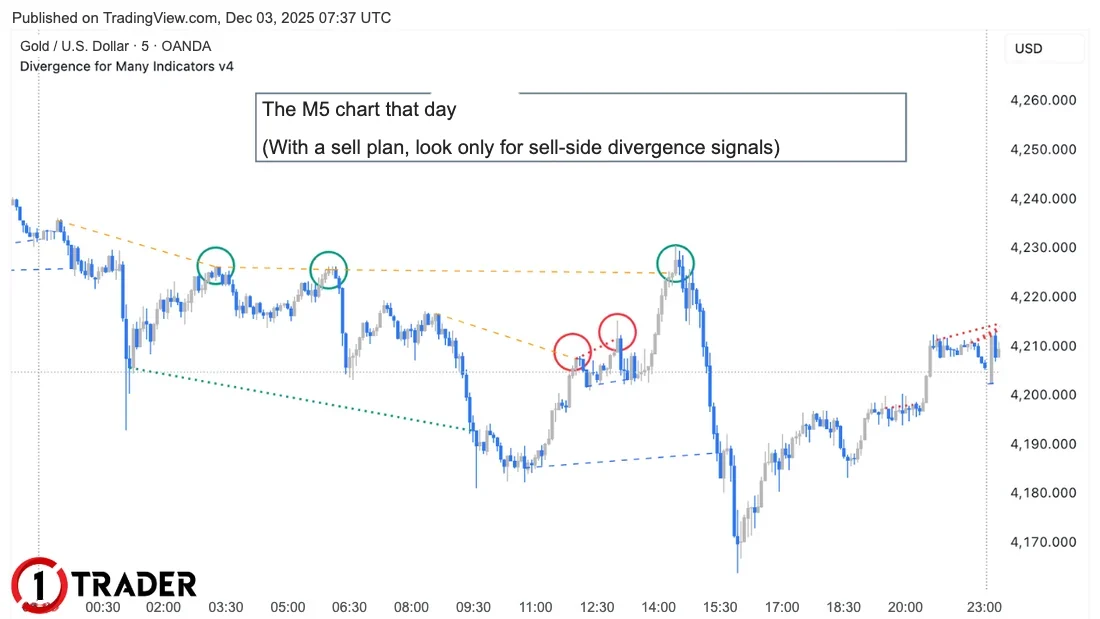
Once you sell on the divergence signal, hold it to take profit at the TP in your H1 sell plan. The chart below shows how the plan played out that day: price fell from the resistance zone to test the target around 4,186.
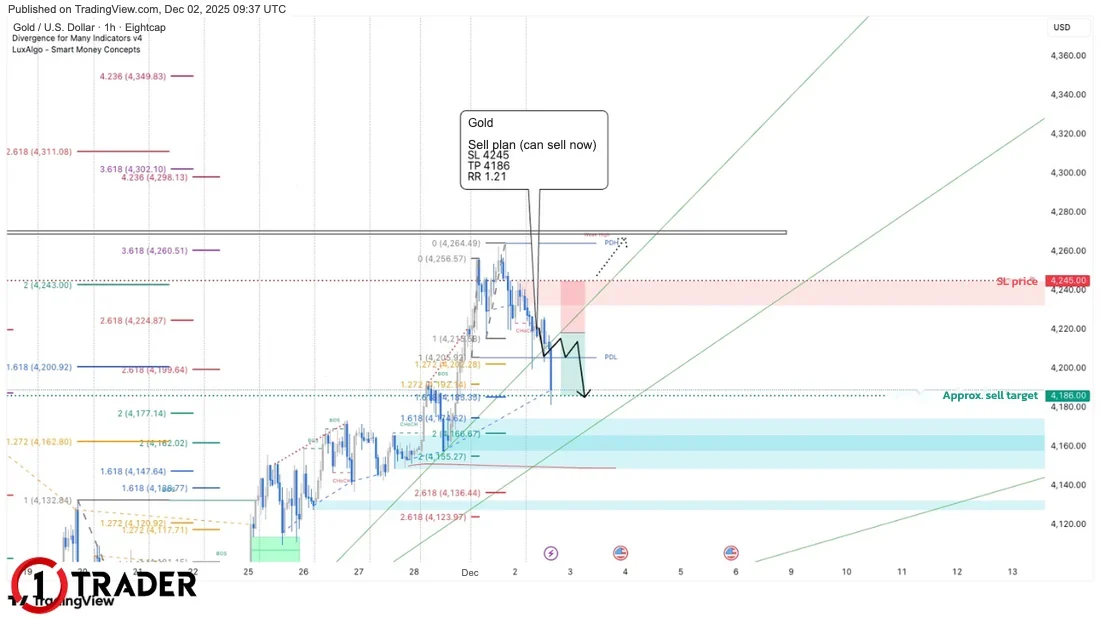
Caution: look for divergence entries on M5–M15 because they allow a tighter SL, but always have a clear trade plan first (with an SL/TP behind it). Don’t trade every signal you see, and avoid big news, as shown on Forex Factory (EP21).
Summary: planning and finding day-trade entries
| Step | Timeframe | What to do | What you get |
|---|---|---|---|
| 1. Market Structure | D1 → H4 → H1 | Identify uptrend, downtrend or sideways | Whether to look for buys or sells |
| 2. Support and resistance | D1 → H1 | Mark demand/supply, OB, FVG, FIBO, trendline zones | The zones to focus on |
| 3. Set the plan | H1 | Combine the trend and zones into a plan | Side · SL · TP · RR |
| 4. Entry | M5 – M15 | Find divergence that matches the plan at key zones | Entry timing and a tighter SL |
Plan first, find the entry later, and don’t trade without a signal at your zone
Make your plan every day before the European session opens, record the plan and the result in your trading journal (EP28), and backtest (EP10) it for at least 30 days before using real money, controlling the risk per trade as in Money Management (EP9).
Frequently asked questions about day trading plans
What is a day trading plan?
A day trading plan decides before the market opens whether you will buy or sell that day, where your stop loss (SL) and take profit (TP) are, and whether the risk/reward is worth it, so you act on the plan rather than on emotion while price swings.
Which timeframes should I use to build a day trading plan?
Look at the big picture from D1 down to H4 and H1 to read the trend and support and resistance, then set the plan on H1, the main timeframe most day traders use. After that, drop to M5–M15 to time your entry.
If D1 is an uptrend but H1 is a downtrend, which side should I plan for?
In this example the plan follows the H1 trend, whose downtrend structure is still intact, with the SL above the H1 downtrend swing high and the TP at nearby support. Because it trades against the bigger trend, the target should be short, and the plan is cancelled as soon as price breaks the resistance used as the SL.
How is the RR of 1.21 in the plan calculated?
RR is the reward distance compared with the risk distance. Selling around 4,218, the distance to the 4,245 SL is about $27 and to the 4,186 TP about $32, giving an RR of about 1.2. A different real entry price changes the RR.
Which indicator is used to find divergence?
This article uses Divergence for Many Indicators v4 on TradingView, which is free and draws divergence lines automatically. See how to install and set it up in EP18.
Why shouldn’t I trade divergence that isn’t at resistance?
Because divergence only says momentum is starting to fade. If it doesn’t form at key higher-timeframe resistance, price often just pauses and carries on. The signals that carry weight are divergences that form on the resistance zone in your plan.
What if price never reaches my entry or there is no signal?
Don’t enter. A good trade plan has both entry and cancellation conditions. If there is no signal at the zone, or price breaks the SL first, cancel the plan for that day and analyse again. Not trading is part of the plan too.
Read EP32 again Next lesson · EP34 How to Backtest with TradingView (Paid Plans): Using Bar Replay Essential · cut the chart · step bar by bar · record your win rate
Read EP34 →
See all lessons in the free Forex and gold trading course
Risk warning: Trading leveraged Forex, gold and CFDs carries a high level of risk and you may lose all the money you invest. The trade plan example in this article is a past analysis for education. Past results do not guarantee future results. 1TRADER is a partner (IB) of some brokers and provides information to support your own decisions only. Read the full risk disclosure.