
A Deep Dive into Chart Patterns You Should Know
The 4 groups of chart patterns, continuation · neutral · reversal · wedges and harmonics, with how to find entries, place your SL and set price targets with the measured move.
Quick summary before you read
- Chart patterns are chart shapes that repeat because of how buyers and sellers behave; use them to plan your entry, SL and price target
- 4 groups: Continuation same direction · Neutral waiting for a breakout · Reversal trend turning · Special wedges and harmonics
- Set targets with the measured move: take the pattern’s height and project it from the breakout point
- Wait for the pattern to complete + a close beyond it before entering · always set an SL · no pattern wins 100% of the time
What are chart patterns, and why do traders need them?
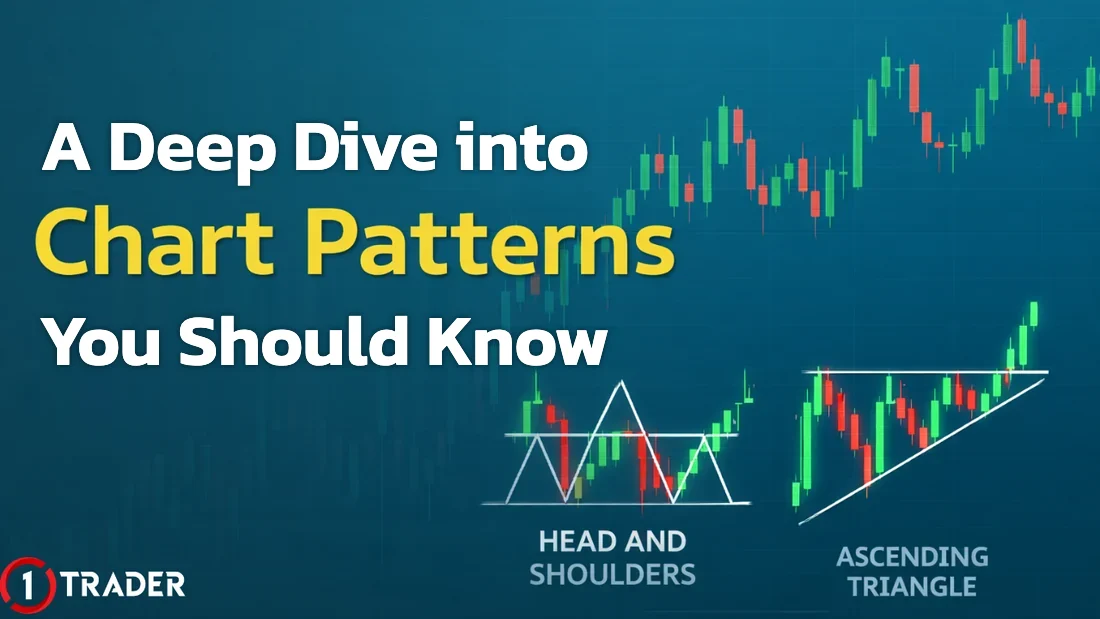
Chart patterns are a core tool of technical analysis, because market behaviour such as greed, fear and waiting to see which way things go tends to show up as similar shapes. They work on gold, Forex, stocks, crypto and futures, but that doesn’t mean history repeats every time. Always read them together with the trend (EP1) and support and resistance (EP26).
Chart pattern cheat sheet: 4 groups
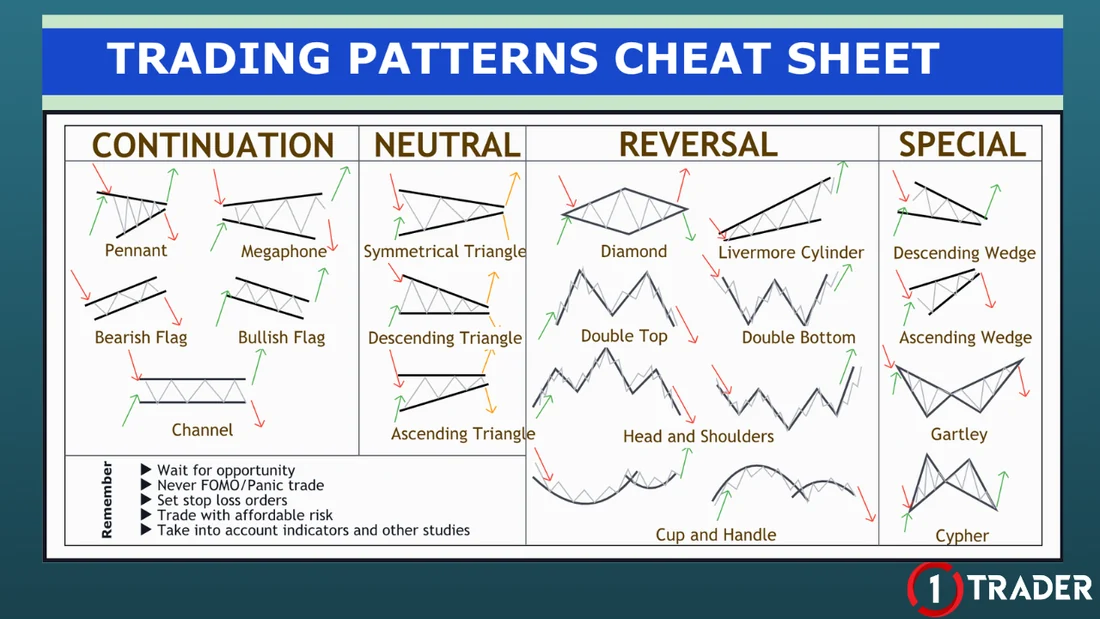
Different sources group patterns slightly differently. This cheat sheet puts every triangle under Neutral, but many treat the Ascending Triangle as bullish and Cup and Handle as a continuation pattern. What matters more than the group name is which way price actually breaks.
Continuation patterns: price keeps its direction
This group says “the trend is still strong; it pauses briefly, then carries on”. These patterns often form after a strong move with long candles: the market pauses to build up, then moves on in the same direction.
After a strong move forms the flagpole, price rests in a parallel channel sloping against the trend, then breaks out in the original direction
Like a flag, but the pause squeezes into a small triangle before breaking out in the original direction
Price moves in a parallel channel sloping up or down. Trade in the channel’s direction and be careful when it breaks out
Highs get higher and lows get lower as the range widens, meaning volatility is rising. Many sources also see it as a reversal signal, so reduce your lot size
Target from the flagpole length
Measured move
Neutral patterns: price waits to pick a direction
This group says “the market is undecided, waiting to see which way it breaks”. Buying and selling pressure are evenly matched and price keeps narrowing (consolidation). The direction isn’t clear until price closes outside the range (breakout).
Lower highs and higher lows squeeze together. Neither side has the edge, so trade the direction of the break
Lows keep rising but hit the same resistance. Buyers press on resistance, favouring an upside break
Highs keep falling but hold the same support. Sellers press on support, favouring a downside break
Triangles are easiest to trade when you wait for a candle to close outside and place your SL on the other side. Watch out for false breakouts around big news. See how to spot sideways markets in Sideways markets (EP2).
Reversal patterns: the trend turns
This group matters a lot, because it says “the old trend is ending; get ready for it to turn”, from up to down or down to up. Read the basics of reversals in Trend reversals (EP3).
Price hits the same resistance or support twice and fails to break it. Confirmed when price closes through the neckline
Left shoulder, head, right shoulder: the classic bearish reversal. The inverse version is a bullish reversal
A rounded cup-shaped base followed by a short handle, often seen in assets that build up over a long time. Many sources treat it as a bullish continuation pattern
More complex shapes that reflect distribution at a top or accumulation at a bottom. They are rare, so use them with other tools
Target after the neckline breaks
Target after the neckline breaks
Special patterns: wedges and harmonics
In the cheat sheet, this group combines 2 types of pattern with specific rules: wedges, which appear in both rising and falling markets, and harmonic patterns, which must be measured with Fibonacci ratios.
The range slopes up but narrows as buying pressure fades. It usually ends with a downside break, against the wedge’s direction
The range slopes down but narrows as selling pressure fades. It usually ends with an upside break
Harmonic patterns · Gartley and Cypher
Harmonics use points X, A, B, C and D, and each leg must be measured with FIBO (EP8) to match set ratios. If the ratios don’t match, it doesn’t count as that pattern, which makes this advanced material.
- Gartley
- B ≈ 0.618 of XA · C = 0.382–0.886 of AB · D ≈ 0.786 of XA (the entry zone)
- Cypher
- B = 0.382–0.618 of XA · C extends beyond A to about 1.272–1.414 of XA · D ≈ 0.786 of XC
Harmonics give a clear reversal zone, but they are not always accurate. Wait for a confirming candle at point D and place your SL beyond point X or just beyond the D zone.
5 reminders for pattern traders
Summary table: the 4 chart pattern groups
| Group | What the market says | Main patterns | How to trade |
|---|---|---|---|
| Continuation | The trend is still strong | Flag · Pennant · Channel · Megaphone | Enter with the trend when the pause breaks |
| Neutral | Undecided, waiting to pick a side | Symmetrical · Ascending · Descending Triangle | Wait for a close outside, then follow that direction |
| Reversal | The old trend is ending | Double Top/Bottom · Head and Shoulders · Cup and Handle | Wait for the neckline break; target with the measured move |
| Special | A specific reversal zone | Rising/Falling Wedge · Gartley · Cypher | Measure ratios with FIBO; wait for confirmation at D |
Knowing patterns tells you where to wait, where to enter and where to get out, but no pattern wins 100% of the time
Before using real money, backtest your favourite patterns for at least 30 trades with Bar Replay in TradingView (EP34) or free backtesting sites (EP10), and work out the RR of every trade using Risk/Reward (EP22).
Frequently asked questions about chart patterns
What are chart patterns?
Chart patterns are price-chart shapes that repeat because of how buyers and sellers behave, such as flags, triangles and head and shoulders. They are used to judge whether price is likely to continue, pick a direction or reverse, so you can plan your entry, stop loss and price target.
How many groups of chart patterns are there?
The cheat sheet in this article uses 4 groups: Continuation (same direction), Neutral (waiting to pick a direction), Reversal and Special (wedges and harmonics). Sources group them slightly differently; some treat the Ascending Triangle as a bullish continuation pattern, for example.
How do you set a price target for head and shoulders?
Measure the distance from the top of the head down to the neckline, then subtract it from the point where price breaks the neckline. For example, head 4,380 and neckline 4,300 give a distance of $80 and a target of about 4,220. The target is an estimate; price may fall short or overshoot.
What’s the difference between a rising wedge and a falling wedge?
A rising wedge points up with a narrowing range and usually ends with a downside break. A falling wedge points down with a narrowing range and usually ends with an upside break. Both warn that the current trend is losing strength.
What do you use to measure a harmonic pattern like the Gartley?
Fibonacci, to measure the ratio of each leg. In a Gartley, point B should be around 0.618 of the XA leg and point D around 0.786 of XA. If the ratios don’t match, it doesn’t count as that pattern, so it suits traders who are already comfortable with FIBO.
When should I enter after spotting a pattern?
Wait for the pattern to complete and for price to close through the key line, such as a close below the neckline or above a triangle, then place your stop loss on the opposite side of the pattern. Entering before the pattern finishes carries a high risk of being faked out.
How accurate are chart patterns?
No pattern wins 100% of the time, and any pattern can fail. Use them with the trend, support and resistance, volume or indicators such as RSI and MACD, and always set a stop loss. Backtest them to see your own statistics before trading them live.
Read EP34 again Next lesson · EP36 Free FVG Indicator for TradingView and How to Use IFVG Nephew_Sam_ · MTF · Fair Value Gap · Inversion FVG
Read EP36 →
See all lessons in the free Forex and gold trading course
Risk warning: Trading leveraged Forex, gold and CFDs carries a high level of risk and you may lose all the money you invest. Chart patterns are a tool for weighing probabilities and do not guarantee results. The figures in this article are examples for education. 1TRADER is a partner (IB) of some brokers and provides information to support your own decisions only. Read the full risk disclosure.