
6 Candlestick Patterns Every Beginner Should Remember
Read the 6 most common candlestick patterns, Doji, Hammer, Engulfing, Pin Bar, Morning/Evening Star and Inside Bar, to tell when the market is undecided, rejecting a price or turning, with a gold chart example.
Quick summary before you read
- One candle shows the open, close, high and low (OHLC) · long body = clear pressure · long wick = price rejected
- Doji undecided · Hammer / Pin Bar price rejection · Engulfing and Morning/Evening Star reversal · Inside Bar building up before a break
- Patterns carry weight when they form at support, resistance or a key zone, and you must wait for the candle to close before reading them
- No pattern is 100% accurate; use them with the trend and market structure, and always set an SL
What is a candlestick chart, and how do you read it?
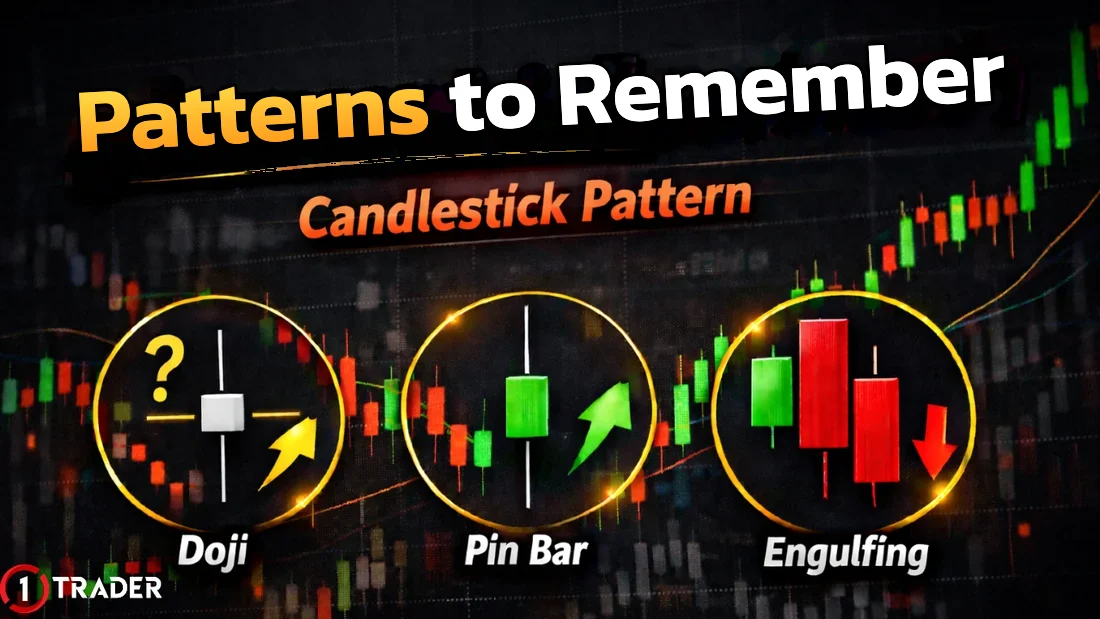
One candle shows 4 values: the open, close, high and low (OHLC). The thick part is the body, and the thin lines above and below are the wicks (shadows). A long body means one side is clearly in control, while a long wick means price reached that level and was pushed back. Japanese candlesticks trace back to rice merchants such as Munehisa Homma.
- Rule 1
- Wait for the candle to close before reading the pattern. A candle that hasn’t closed can still change shape
- Rule 2
- Look at location before shape. A pattern at support and resistance (EP26) or a demand/supply zone (EP5) carries more weight than one in the middle of the chart
- Rule 3
- Check the trend context. A reversal pattern needs an existing trend to reverse; review it in Trend reversals (EP3)
Doji: the market is undecided
A Doji is a candle where the open and close are equal or very close, so the body is just a thin line. It shows buyers and sellers are evenly matched and the market hasn’t decided. Watch for a reversal, especially when it forms at support or resistance after a long trend.
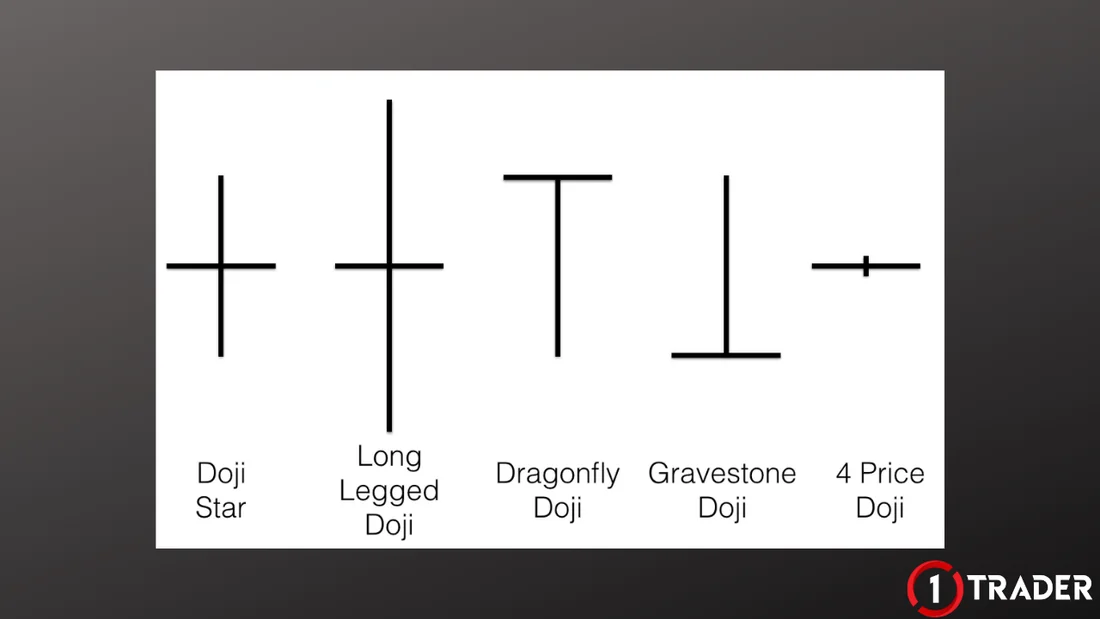
- Doji Star
- Short upper and lower wicks; general indecision
- Long Legged
- Long wicks on both sides; price swings hard but closes where it opened, showing strong indecision
- Dragonfly
- Long lower wick, open and close near the high; buyers pushed price back up. At support, it can signal a move up
- Gravestone
- Long upper wick, open and close near the low; sellers pushed price back down. At resistance, it can signal a move down
- 4 Price Doji
- Open, close, high and low are all equal, forming a single line. It usually appears when liquidity is very low and is rarely used as a signal
A Doji in the middle of a sideways range (EP2) means very little. Always wait for the next candle to confirm the direction before entering.
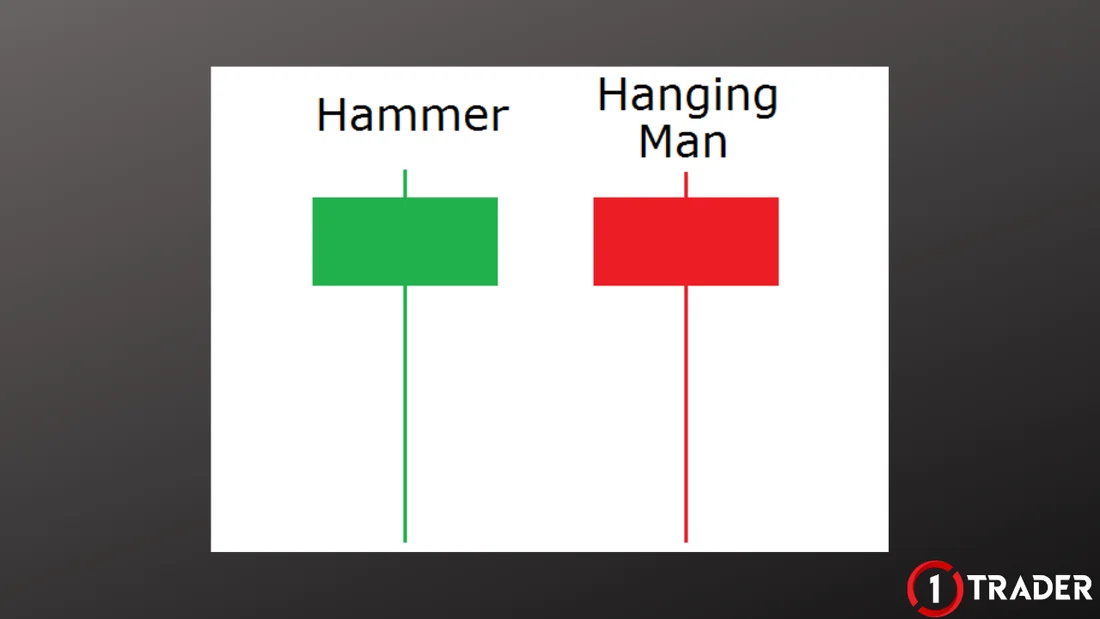
Hammer / Hanging Man: same shape, different location
Both have a small body at the top and a lower wick at least about twice the body’s length, with a very short or no upper wick. What separates them is which trend they follow, not the candle’s colour.
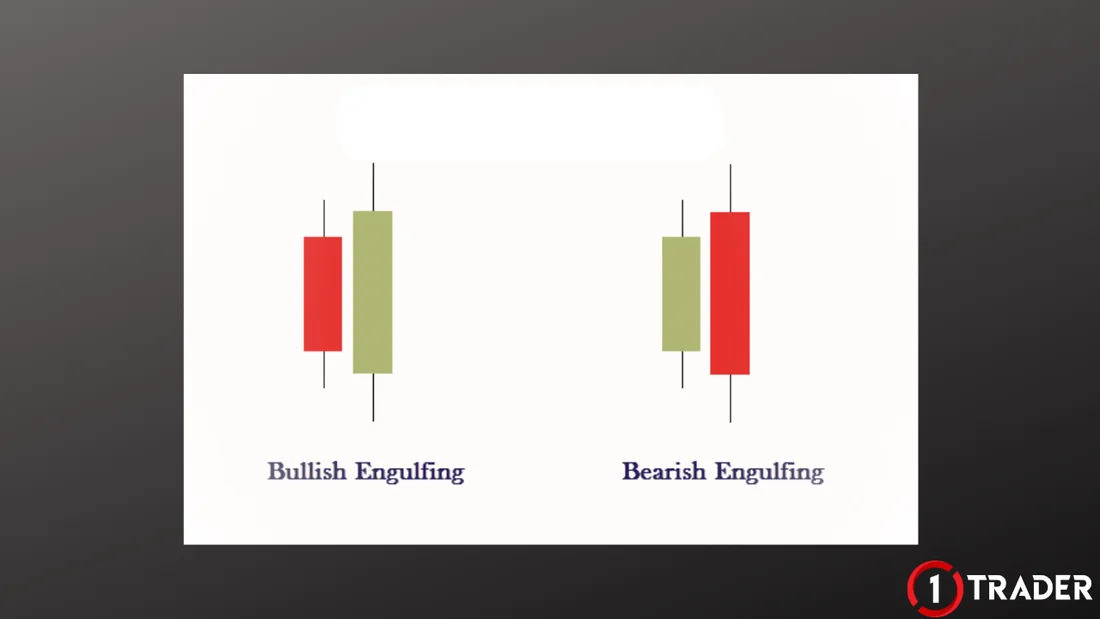
Engulfing pattern: the second candle swallows the first
Engulfing is a 2-candle pattern where the second body is big enough to cover the whole first body and has the opposite colour, meaning the other side has clearly taken control. It is one of the most popular reversal patterns, but it is not accurate every time; it is more reliable after a clear trend and at a key zone.
Pin Bar: a clear price rejection
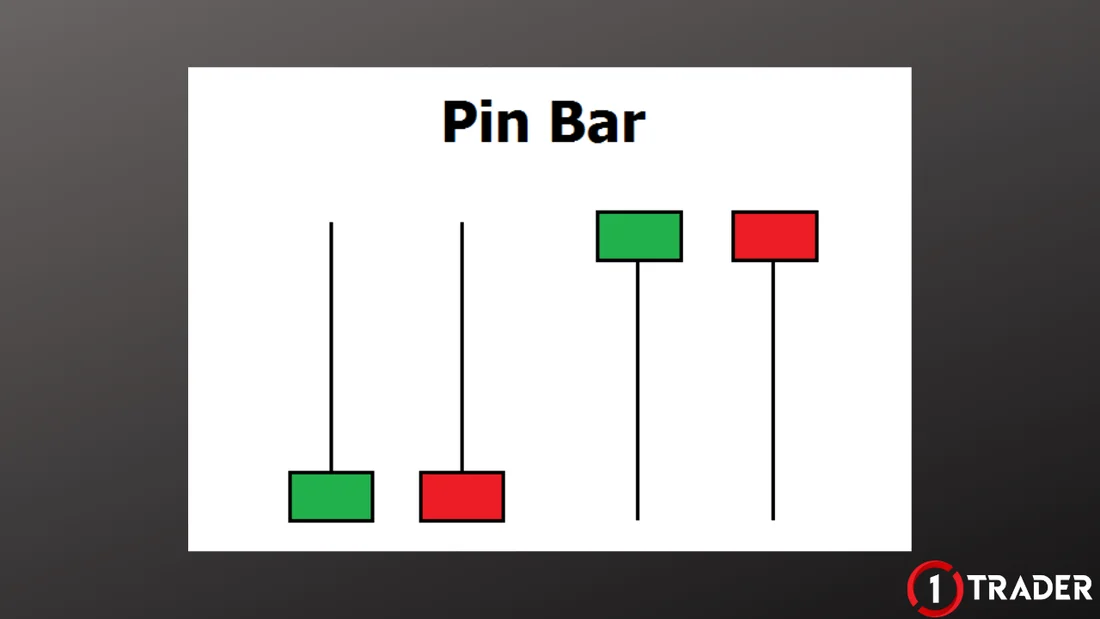
A Pin Bar is a candle with one long wick (about 2/3 of the candle’s range or more) and a small body at the other end. It shows the market clearly rejected that price zone. It is usually used with support and resistance or supply/demand zones.
- Long lower wick
- Bullish Pin Bar, lower prices rejected. Look to buy when the wick pierces support (a Hammer is one kind of bullish Pin Bar)
- Long upper wick
- Bearish Pin Bar, higher prices rejected. Look to sell when the wick pierces resistance (similar to a Shooting Star)
- Entry
- When price breaks the Pin Bar’s high/low, or wait for a pullback to half the candle
- Stop Loss
- Just beyond the tip of the wick
Entry and stop loss
Work out the RR before entering
A lower wick of 16 out of a 25 range is about 64%, close to the 2/3 guideline. The longer the wick and the deeper it pierces the zone, the clearer the signal. Work out the RR of every trade using Risk/Reward (EP22).
Morning Star / Evening Star: 3-candle reversals
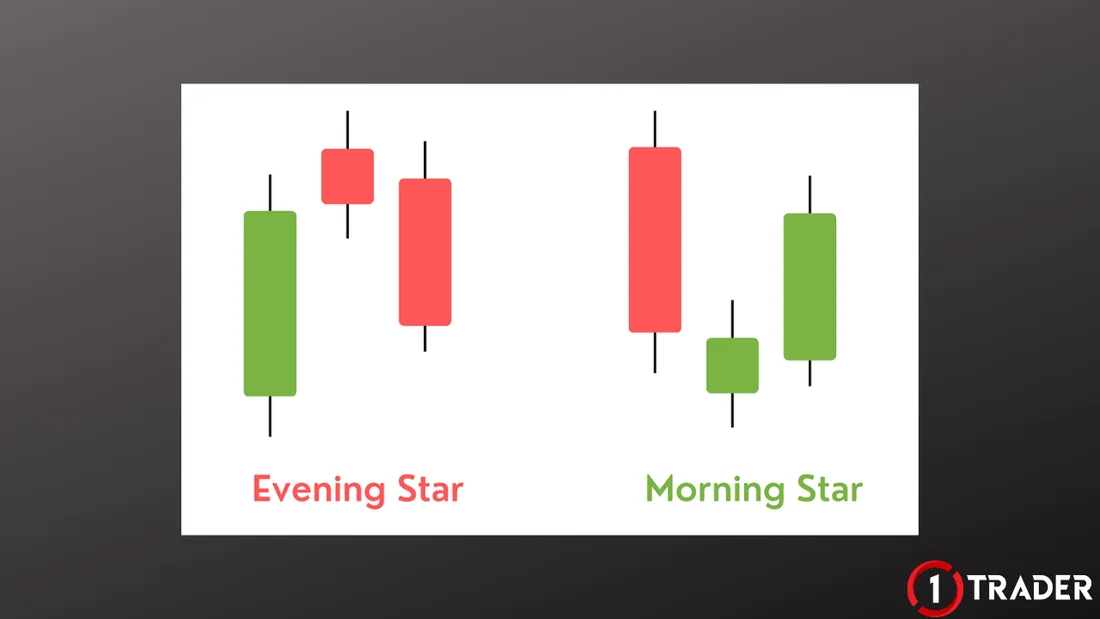
A 3-candle pattern that shows control clearly changing hands. The middle candle is a small-bodied star showing the old pressure is fading, then the third candle moves the other way and closes beyond the middle of the first body. It is a good pattern for finding entries as a trend turns.
Inside Bar: building up before a break
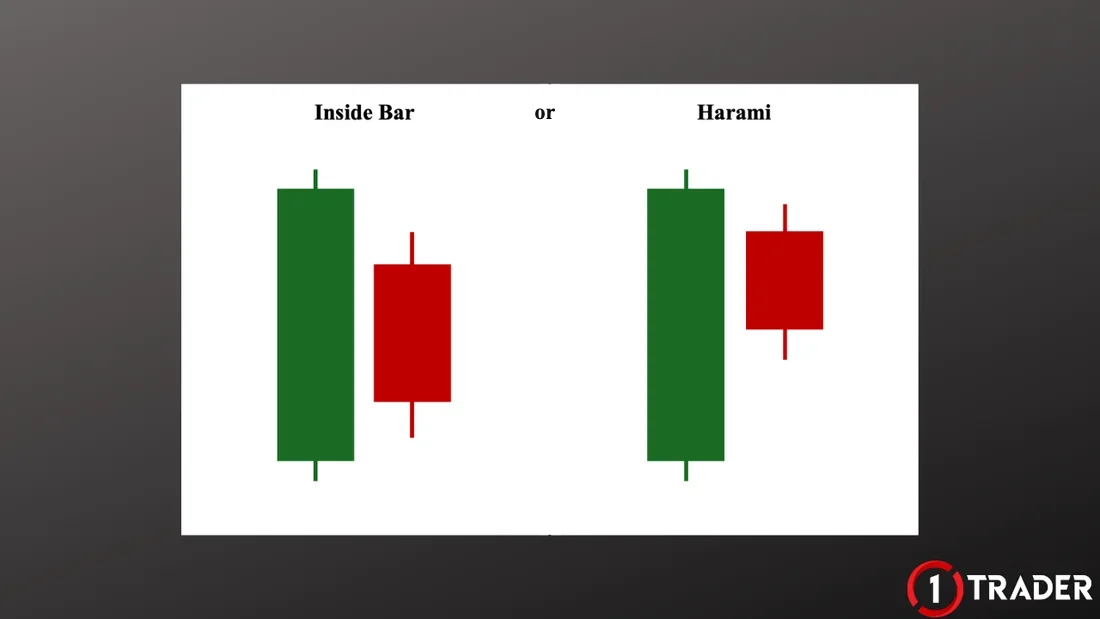
An Inside Bar is a candle whose high and low are both inside the range of the previous candle (the mother bar). It shows the market pausing to build up before a break, which suits breakout traders.
- Inside Bar
- Both the high and the low are inside the mother bar’s range
- Harami
- Only the second body must sit inside the first body; the wicks can stick out, so not every Harami is an Inside Bar
- How to trade
- Place an order for a break of the mother bar’s high/low in the direction of the main trend, with the SL on the other side of the mother bar
- Watch out
- False breakouts around big news; check the news calendar (EP21) first
Summary table: 6 candlestick patterns
| Pattern | Candles | Signal | Works best when |
|---|---|---|---|
| Doji | 1 | Indecision, watch for a reversal | It forms after a long trend at support or resistance |
| Hammer / Hanging Man | 1 | Hammer bullish reversal · Hanging Man bearish reversal | The next candle confirms it |
| Engulfing | 2 | Bullish reversal up · Bearish reversal down | It forms at a demand/supply zone |
| Pin Bar | 1 | Price rejection | The wick pierces support or resistance |
| Morning / Evening Star | 3 | Trend reversal | Candle 3 closes beyond half the first candle |
| Inside Bar | 2 | Building up before a break | It breaks in the main trend’s direction |
Reading candles = reading market behaviour, but no pattern is 100% accurate
Candlestick patterns give you a much bigger edge when combined with support and resistance, the trend, chart patterns (EP35) or indicators such as RSI (EP17). Before using real money, backtest them with Bar Replay (EP34) for at least 30 trades and record the results in your trading journal (EP28).
Frequently asked questions about candlestick patterns
What is a candlestick pattern?
A candlestick pattern is a shape made by 1–3 candles that repeats on the chart and reflects buying and selling pressure in that period. Each candle shows the open, close, high and low (OHLC). Traders use these patterns to judge whether the market is undecided, rejecting a price or likely to reverse, so they can find entries and place stop losses.
Which candlestick patterns should beginners remember?
The 6 most common are Doji, Hammer / Hanging Man, Engulfing, Pin Bar, Morning Star / Evening Star and Inside Bar. Together they cover indecision, price rejection, reversals and building up before a break.
What’s the difference between a Hammer and a Hanging Man?
They have the same shape: a small body at the top and a lower wick at least about twice the body’s length. The difference is location. A Hammer forms after a downtrend and suggests a move up, while a Hanging Man forms after an uptrend and suggests a move down. The body’s colour doesn’t decide it, and you should wait for the next candle to confirm before entering.
Is a Pin Bar the same as a Hammer?
A Hammer is one kind of bullish Pin Bar. A Pin Bar is a candle with one long wick and a small body at the other end. It comes with a long lower wick (lower prices rejected) or a long upper wick (higher prices rejected, similar to a Shooting Star). The key is that the wick must pierce support, resistance or a key zone.
What’s the difference between an Inside Bar and a Harami?
An Inside Bar has both its high and low inside the previous candle’s range (the mother bar), while a Harami only needs the second body inside the first body, so the wicks can stick out. Both show the market pausing to build up, and traders usually wait for price to break the mother bar’s range before entering.
Does price always reverse after a Doji?
No. A Doji only shows that the open and close were close together and the market is undecided. A Doji in the middle of a sideways range usually means little, but after a long trend at support or resistance it warns of a possible reversal. Wait for the next candle to confirm the direction.
How accurate are candlestick patterns, and which timeframe should I use?
No pattern is 100% accurate. Patterns on higher timeframes such as H1, H4 and daily are usually more reliable than M1–M5. Wait for the candle to close before reading it, use it with support and resistance, the trend, market structure or indicators, and always set a stop loss.
Read EP36 again Next lesson · EP38 How to Trade With the Trend Without Going Against It HH HL LH LL · Sideways · Multi-timeframe · SL placement
Read EP38 →
See all lessons in the free Forex and gold trading course
Risk warning: Trading leveraged Forex, gold and CFDs carries a high level of risk and you may lose all the money you invest. Candlestick patterns are a tool for weighing probabilities and do not guarantee results. The figures in this article are examples for education. 1TRADER is a partner (IB) of some brokers and provides information to support your own decisions only. Read the full risk disclosure.