
How to Trade With the Trend Without Going Against It
Start from how price behaves, tell uptrends, downtrends and sideways markets apart with HH HL LH LL, then use D1 / H4 / H1 multi-timeframe analysis to know whose trend you are trading, plus how to set your stop loss from price structure.
Quick summary before you read
- How price behaves: price builds momentum to break support and resistance, then runs with the trend · this is part 1/3, on the trend
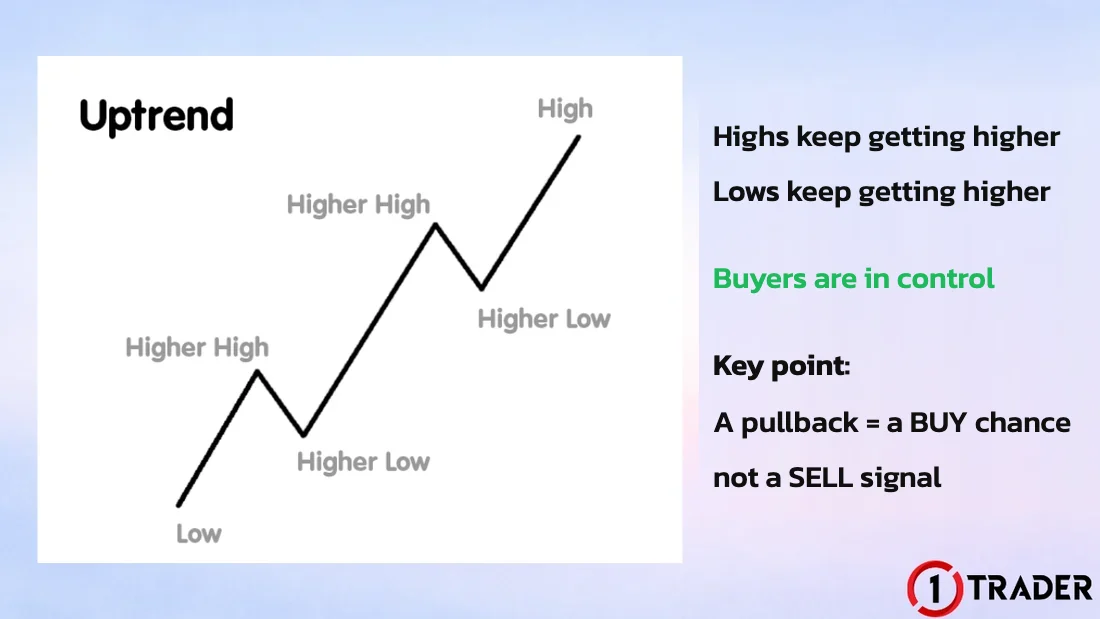
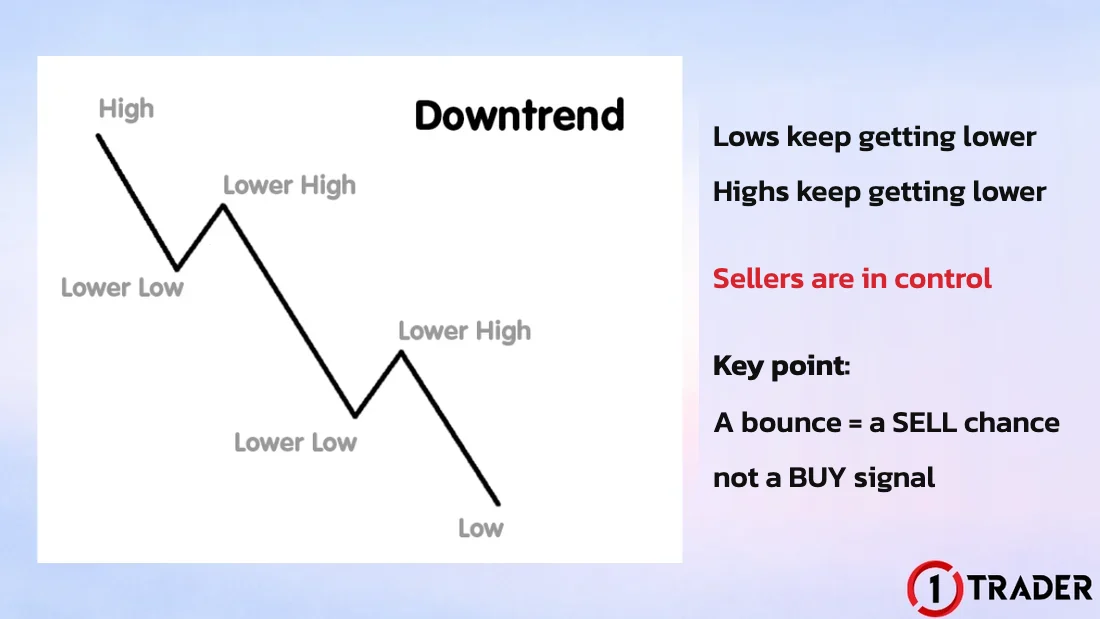
- Uptrend = HH + HL · downtrend = LH + LL · neither = sideways
- Check the trend on 3 timeframes, D1 / H4 / H1. If they agree, trade with the flow; if H1 goes against the big picture, it’s a pullback
- Place the SL from structure: in a downtrend above the latest lower high · in an uptrend below the latest higher low
How price behaves: 3 elements to know
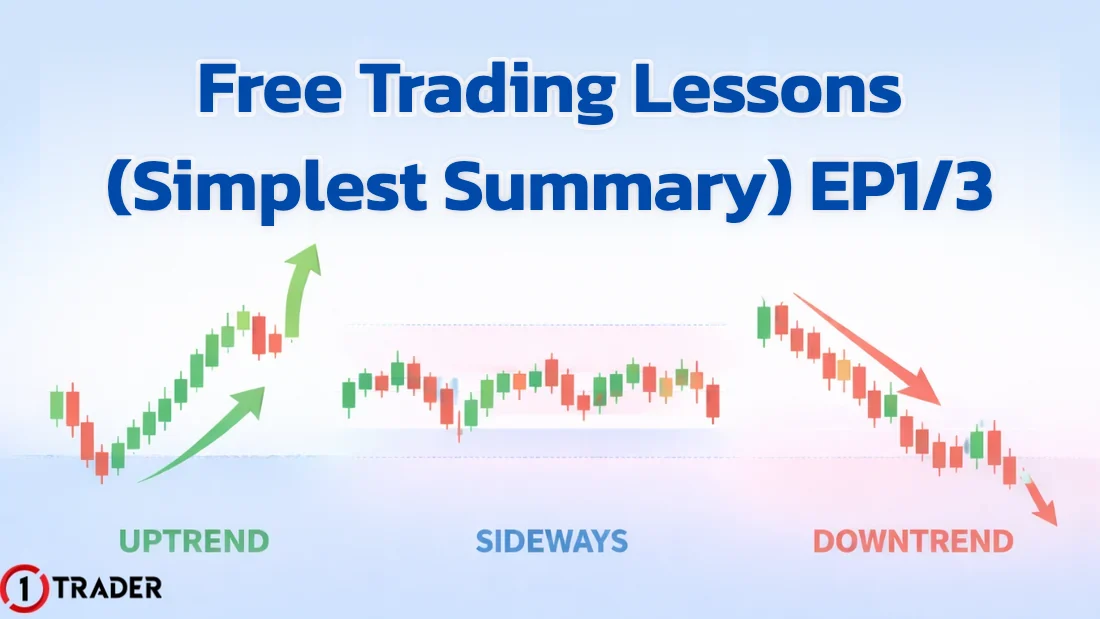
Trading isn’t just pressing buy or sell; it’s putting several pieces of knowledge together. This series picks only the most essential topics and arranges them step by step, so you can finish in 3 parts, starting from one sentence that explains how price behaves.
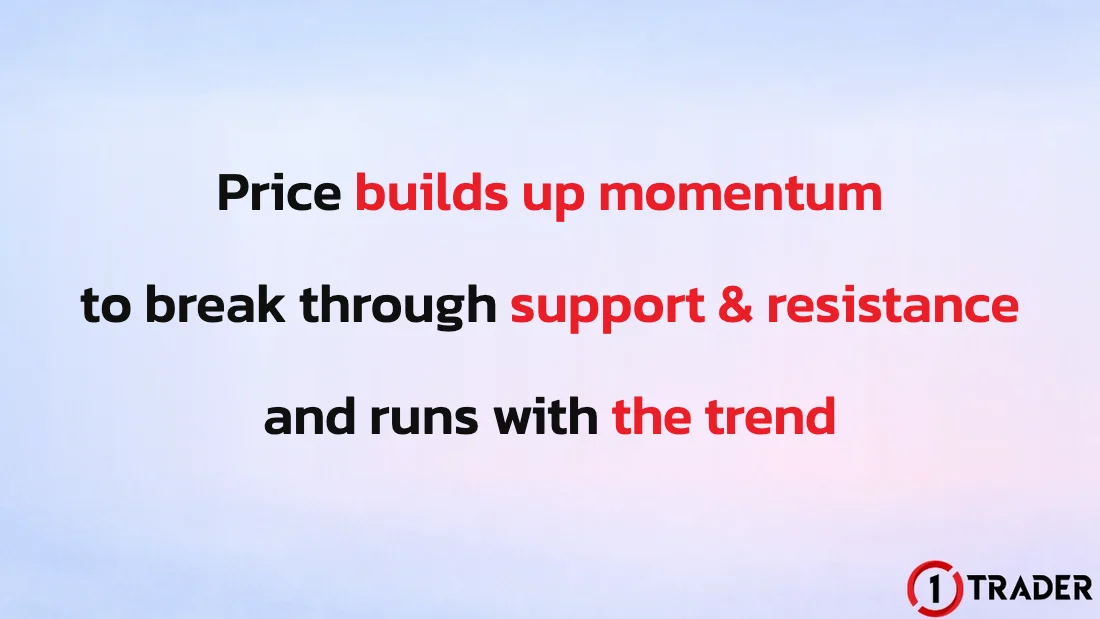
- 1. Trend
- The market’s main direction, covered in this lesson (part 1/3)
- 2. Support and resistance
- Areas where price tends to stop or bounce, part 2/3. Read the basics first in The truth about support and resistance (EP26)
- 3. Building momentum
- The pause before a breakout, part 3/3, related to Sideways markets (EP2)
The first thing to read correctly is the trend, because if you read the trend wrong, no matter how good your system is, the chance of losing is still high.
What is a trend? The market’s main direction
A trend is the direction price moves over a period of time, reflecting the combined behaviour of buyers and sellers. A trend doesn’t come from a few candles; it’s the overall picture of price moving steadily in one direction. Put simply, trend = the market’s main direction, a compass that tells you whether to look for buys or sells.
The trend tells you which side to trade, but not where to enter. Entries need support and resistance, zones or candlestick patterns. Review how to draw trendlines in Trends and trendlines (EP1).
Uptrend / downtrend: read it from HH HL LH LL
Sideways markets: the market is picking a direction
A sideways market is when price can’t clearly make a new high or a new low and swings within a range, with buyers and sellers evenly matched. Sideways isn’t a bad market; it’s the market getting ready to pick a direction.
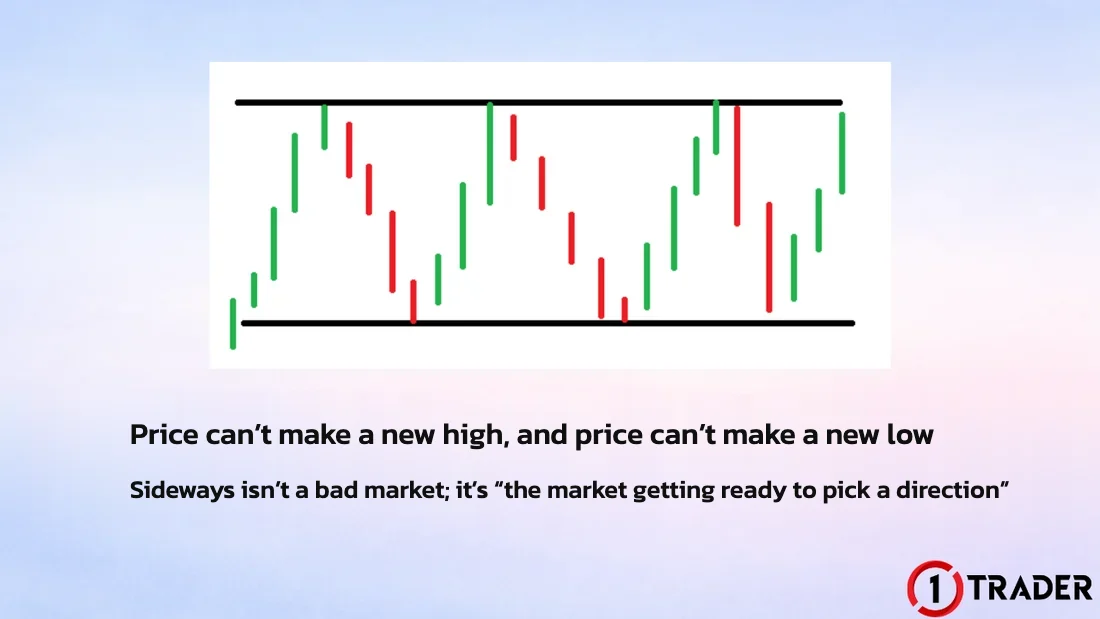
The simplest rule: whenever the chart doesn’t fit either the uptrend or the downtrend rule, treat it as sideways. Read how to trade ranges in Sideways markets (EP2).
Multi-timeframe: reading the trend on D1 / H4 / H1
The most common problems are “I bought and price fell” or “I saw a downtrend but got dragged up”. Most of the time it’s not reading the chart wrong, but looking at only one timeframe without knowing the big picture. Multi-timeframe analysis means analysing more than one timeframe at once, to see both the main trend (big picture) and the entry timing (small picture).
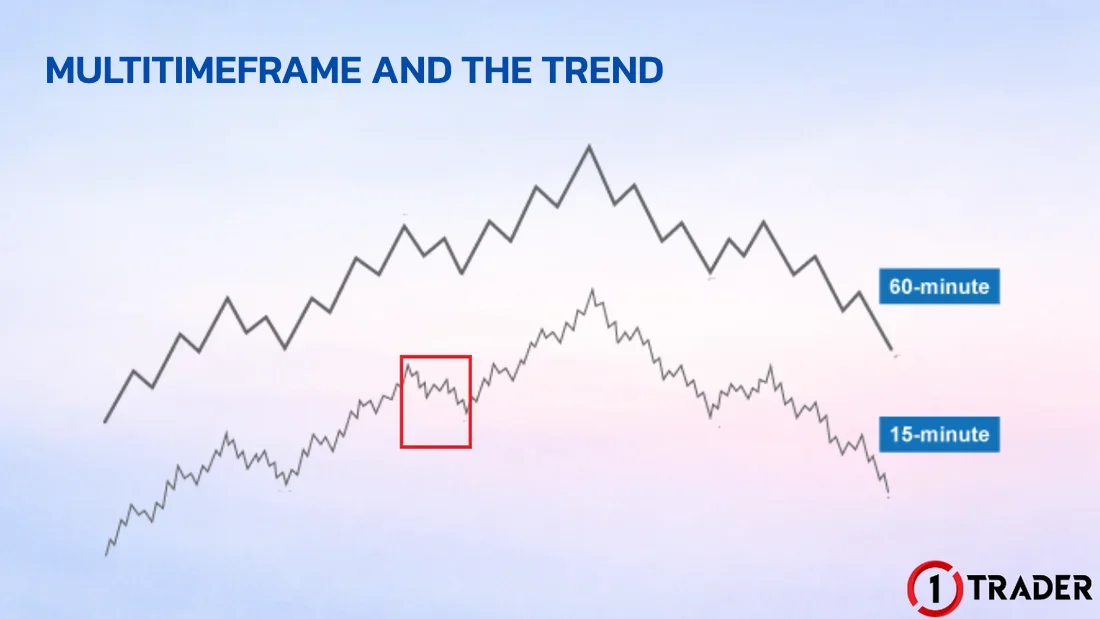
- D1 (Daily)
- The big picture, showing the market’s main direction
- H4 (4 hours)
- The main structure, and the support and resistance used as profit targets
- H1 (1 hour)
- The timeframe you actually trade, used for entry timing and SL placement
Read the step-by-step top-down analysis in Multi-Timeframe (EP19), and how to choose timeframes for your style in Timeframes (EP30).
Example: selling H1 in a bigger uptrend and where to put the stop loss
Suppose D1 and H4 are still in an uptrend, but on H1 price starts making lower highs and lower lows, so H1 is in a downtrend. You can look for sells with the H1 trend, treating it as trading a pullback in the bigger trend.
Structure and entry
Profit target at H4 support
A common misunderstanding: in a downtrend the SL goes above the latest lower high (not above a higher low), because if price gets above that LH, the H1 downtrend structure breaks immediately. As long as price hasn’t broken the latest LH, the downtrend is still intact.
A trade like this goes against the big picture, so don’t expect it to run far. Set the TP at the nearest H4 or D1 support and work out the Risk/Reward (EP22) before every trade. When price makes an HL on H1 again, go back to looking for buys with the big picture.
Why multi-timeframe analysis stops you trading against the trend
Multi-timeframe analysis shows that the big trend = the market’s main direction and the small trend = price pulling back or bouncing. So the difference isn’t whether you buy or sell, but whether you know the timeframe context.
- Caution 1
- Don’t look at so many timeframes that you can’t decide; 3 timeframes are enough
- Caution 2
- Choose a clear main timeframe and use it as your reference every time
- Caution 3
- Market structure matters more than indicators; use indicators such as EMA (EP24) only to confirm
Summary table: trading the trend on 3 timeframes
| Situation | D1 / H4 | H1 | Approach |
|---|---|---|---|
| Aligned uptrend | Up | Up | Buy with the flow, SL below the latest HL |
| Aligned downtrend | Down | Down | Sell with the flow, SL above the latest LH |
| H1 pullback | Up | Down | Short sell with the TP at H4 support, or wait for H1 to turn up, then buy |
| H1 bounce | Down | Up | Short buy with the TP at H4 resistance, or wait for H1 to turn down, then sell |
| Sideways | Unclear | In a range | Wait for a breakout, or trade smaller |
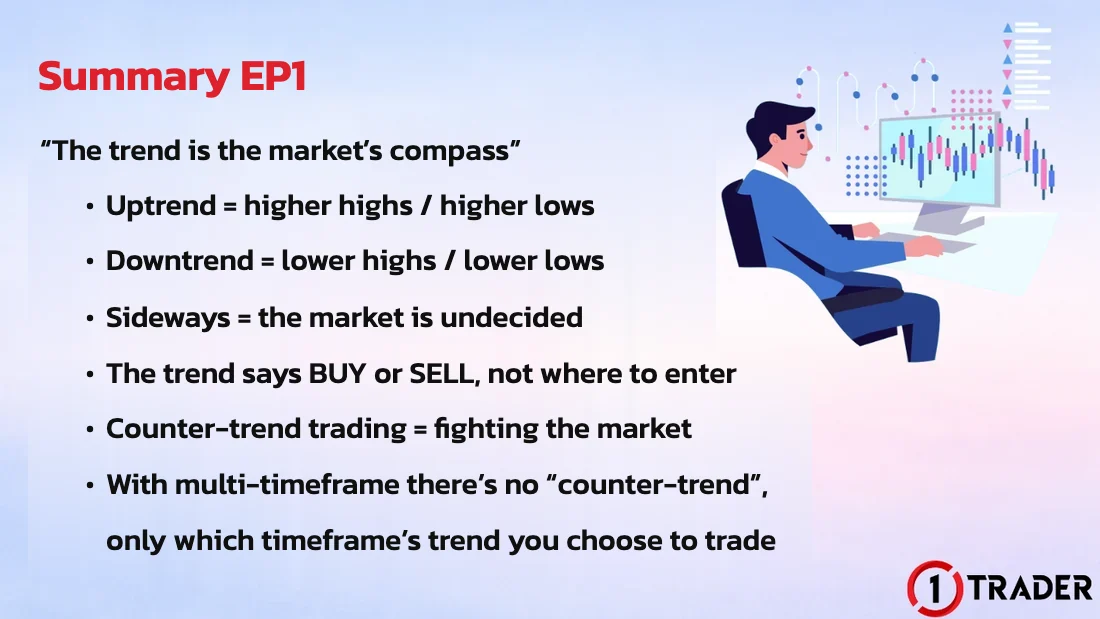
Once you understand multi-timeframe analysis, there’s no such thing as counter-trend, only which timeframe’s trend you choose to trade
The next parts of this series cover support and resistance and building momentum. Meanwhile, practise identifying trends on past charts with Bar Replay (EP34) and record the results in your trading journal (EP28).
Frequently asked questions about trading with the trend
What is a trend, and how do you read it?
A trend is the main direction of price over a period of time, read from the structure of swing highs and swing lows. If price keeps making higher highs and higher lows, it’s an uptrend; if it keeps making lower highs and lower lows, it’s a downtrend. If it fits neither rule, treat it as sideways.
What do HH, HL, LH and LL stand for?
HH = Higher High, a high above the previous one · HL = Higher Low, a low above the previous one · LH = Lower High, a high below the previous one · LL = Lower Low, a low below the previous one. Uptrends use HH + HL, and downtrends use LH + LL.
How do you spot a sideways market, and should you trade it?
A sideways market is when price can’t clearly make a new high or new low and swings within a range, with buyers and sellers evenly matched. The simplest test: if the chart fits neither the uptrend nor the downtrend rule, treat it as sideways. Beginners should wait for a breakout and trade in that direction, or trade the edges of the range with a smaller position.
Which timeframes should I use for multi-timeframe analysis?
For day trading, 3 timeframes are common: D1 for the big picture, H4 for the main structure and H1 for entry timing, each about 4–6 times apart. Don’t use more than 3 timeframes, or you’ll get confused and won’t be able to decide.
Is selling on H1 while D1 is in an uptrend trading against the trend?
If H1 has a clear structure of lower highs and lower lows, selling is trading with the H1 trend during a pullback in the bigger trend, not blindly going against it. But know that the trade won’t run far, so set the TP at H4 or D1 support and use a suitable position size.
Where should I put my stop loss when trading with the trend?
In a downtrend, put the SL above the latest lower high, because if price makes a new high above that point the downtrend structure breaks. In an uptrend, put it below the latest higher low, and always allow a little extra for the spread.
How do I know a trend has ended?
The first sign is a broken structure: in an uptrend, price closes below the latest higher low; in a downtrend, price closes above the latest lower high. It means the trend is weakening and may go sideways or reverse. Wait for a new structure to confirm before switching sides.
Read EP37 again Next lesson · EP39 Support and Resistance Zones with Demand, Supply and FVG Demand Zone · Supply Zone · RBR DBR DBD RBD · FVG
Read EP39 →
See all lessons in the free Forex and gold trading course
Risk warning: Trading leveraged Forex, gold and CFDs carries a high level of risk and you may lose all the money you invest. Trading with the trend improves your odds but does not guarantee results. The figures in this article are examples for education. 1TRADER is a partner (IB) of some brokers and provides information to support your own decisions only. Read the full risk disclosure.