
Support and Resistance Zones with Demand, Supply and FVG
Stop drawing support and resistance as lines and read them as “price areas” with demand zones, supply zones and Fair Value Gaps, so you know where to wait for price and how to place your stop loss clear of the wicks.
Quick summary before you read
- Once you know the trend (part 1/3), the next question is where to wait for price · this is part 2/3, on support and resistance zones
- Demand zone = buying before price surges (RBR, DBR) · supply zone = selling before price drops (DBD, RBD)
- FVG = the gap between the wicks of candles 1–3 after a strong move; price often comes back to fill it, but not every time
- Every zone shows where to wait, not where to enter; always use it with the trend and place the SL outside the zone
You know the trend: where do you wait for price?
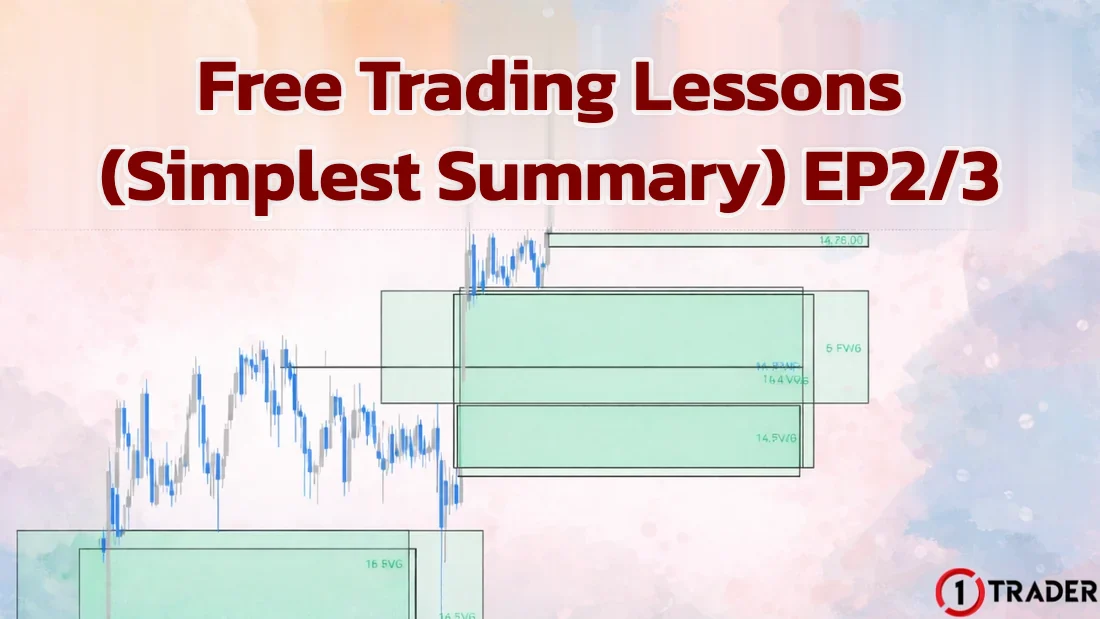
In part 1/3, trading with the trend (EP38), we learned which way the market is going. The next question to answer is “where should I wait to enter?”, because many traders lose for two main reasons: reading the trend wrong and entering at the wrong location.
Why line support and resistance don’t always work
Line support and resistance have an important limitation: the market doesn’t reverse at a “single point”, and price often pokes slightly through the line before reversing. The results are:
- Result 1
- Beginners enter too early, before price has actually reached the real area
- Result 2
- Wicks keep hitting their SL because it sits too close to the line
- Result 3
- They think their system is bad, when the real problem is how they view support and resistance
Read more about the different ways to find support and resistance, and why price breaks or bounces, in The truth about support and resistance (EP26).
Support and resistance are “zones”
In reality, support and resistance are areas (zones), not lines, because the market:
- Reason 1
- Needs time to build up orders
- Reason 2
- Needs room to match buy and sell orders
- Reason 3
- Is moved mainly by big players, who have to build positions across a price range, not at a single price
What is a demand zone? Buying before price surges
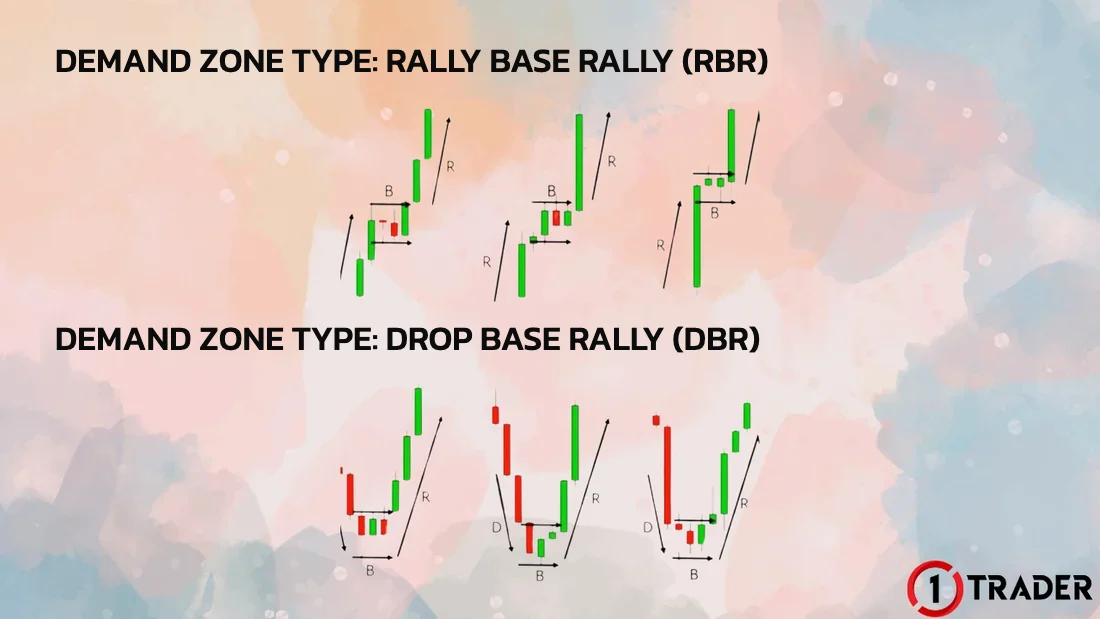
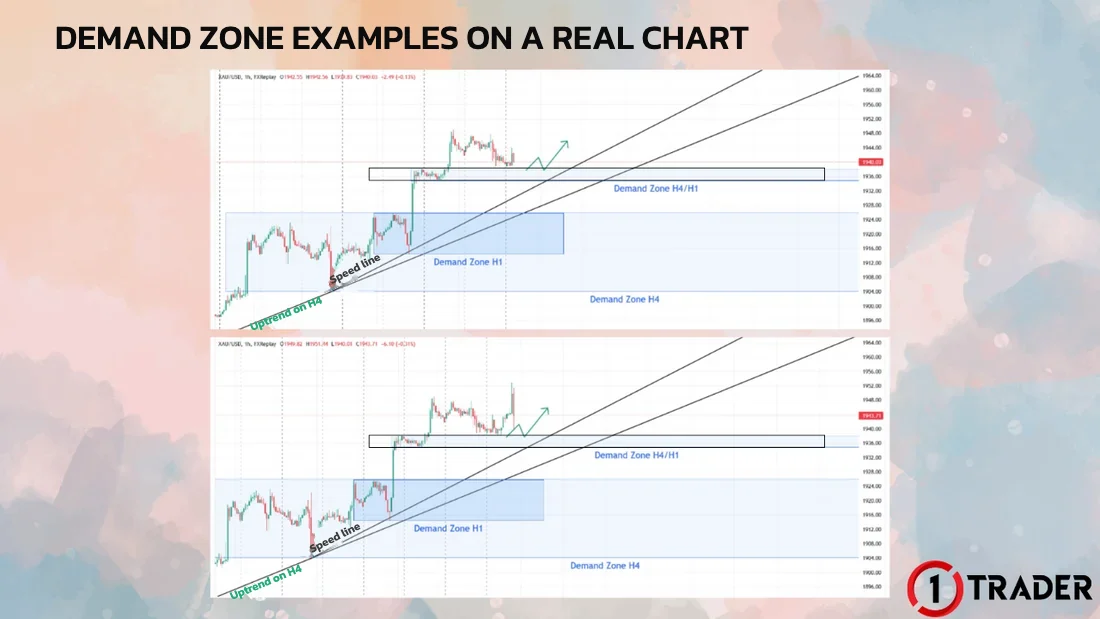
A demand zone is a support area created by heavy buying that drives price up sharply. It forms just before a strong rise, usually as a short pause (base) before the surge, and when price comes back to it, buying may appear again.
What is a supply zone? Selling before price drops
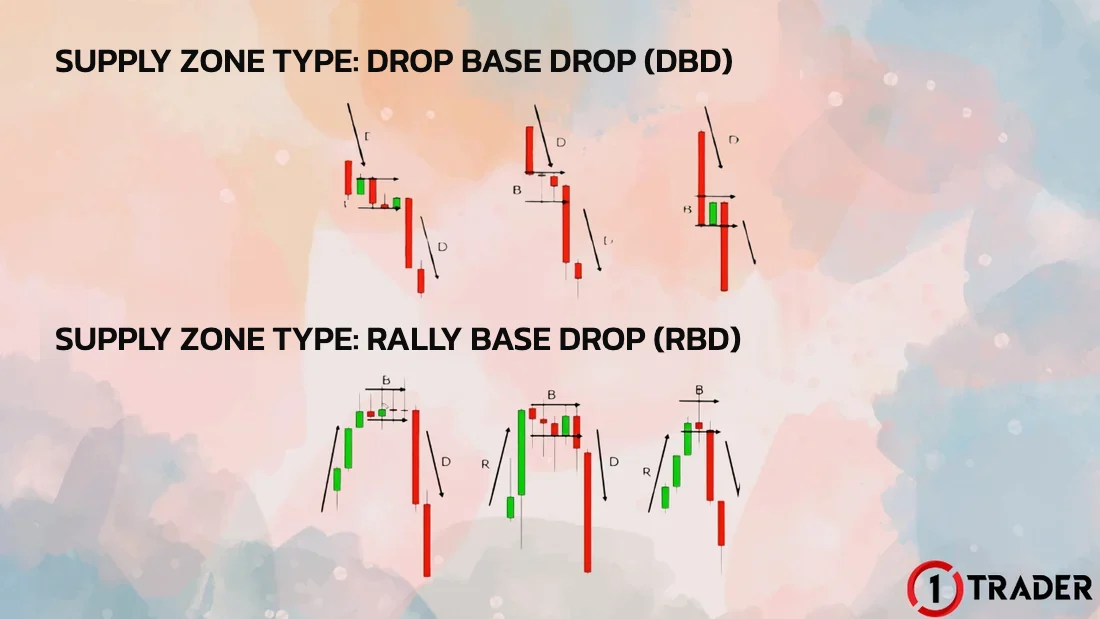
A supply zone is a resistance area created by heavy selling that pushes price down sharply. It forms just before a strong drop, usually as a short pause before the fall, and when price comes back to it, selling may appear again.
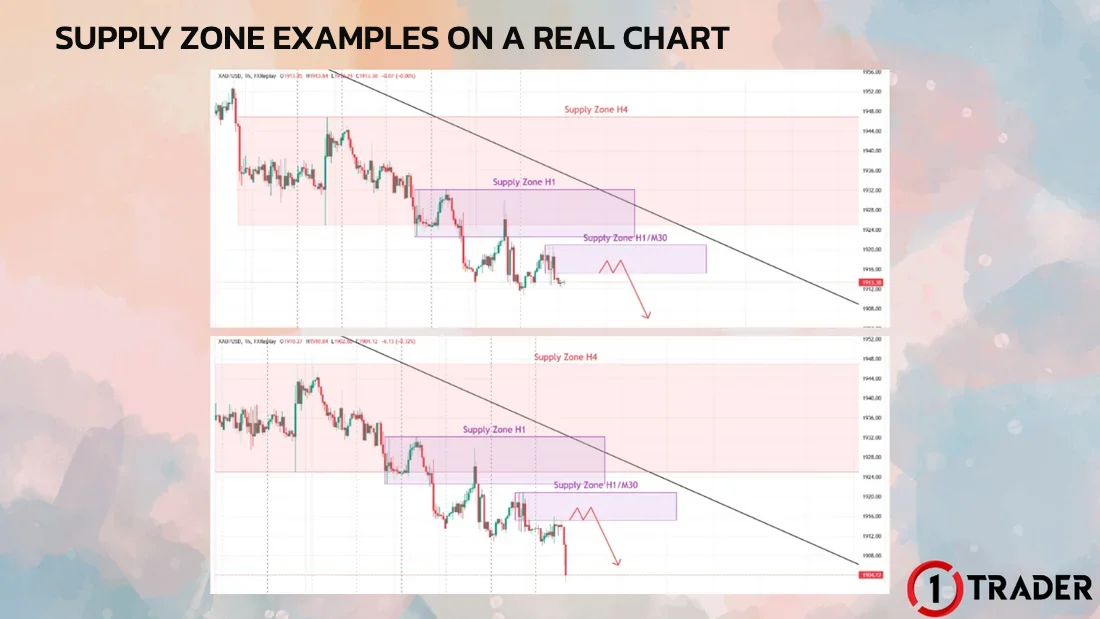
Example: marking zones on a gold H1 chart
A popular way to mark a zone is to find the base candles before the strong move, then draw a box from the outer wick tip of the base to the body edge on the other side. An FVG is marked from the wick of candle 1 to the wick of candle 3.
RBR demand zone
Bullish FVG + SL placement
With the FVG right next to the demand zone, the 4,236–4,252 area carries more weight, but it is still not an entry. When price pulls back into the zone, wait for a confirmation signal on a lower timeframe first, which part 3/3 covers. Meanwhile, review signals in Candlestick patterns (EP37).
- Mistake 1
- Buying as soon as price touches demand
- Mistake 2
- Selling as soon as price touches supply
- The reality
- A zone shows a significant support or resistance area, not an entry point
What is a Fair Value Gap (FVG)?
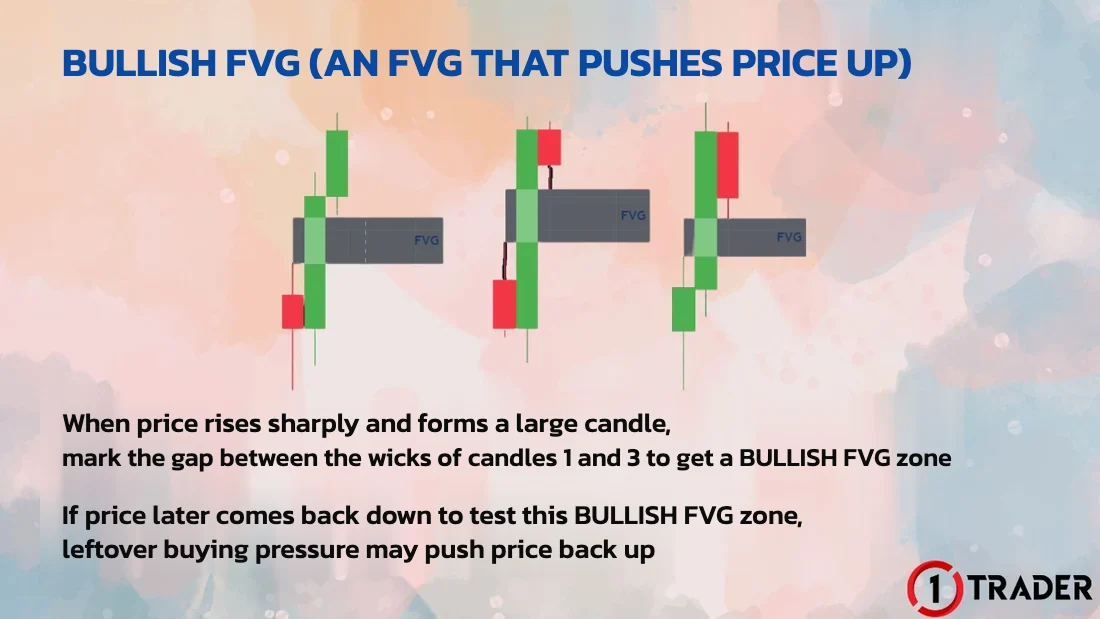
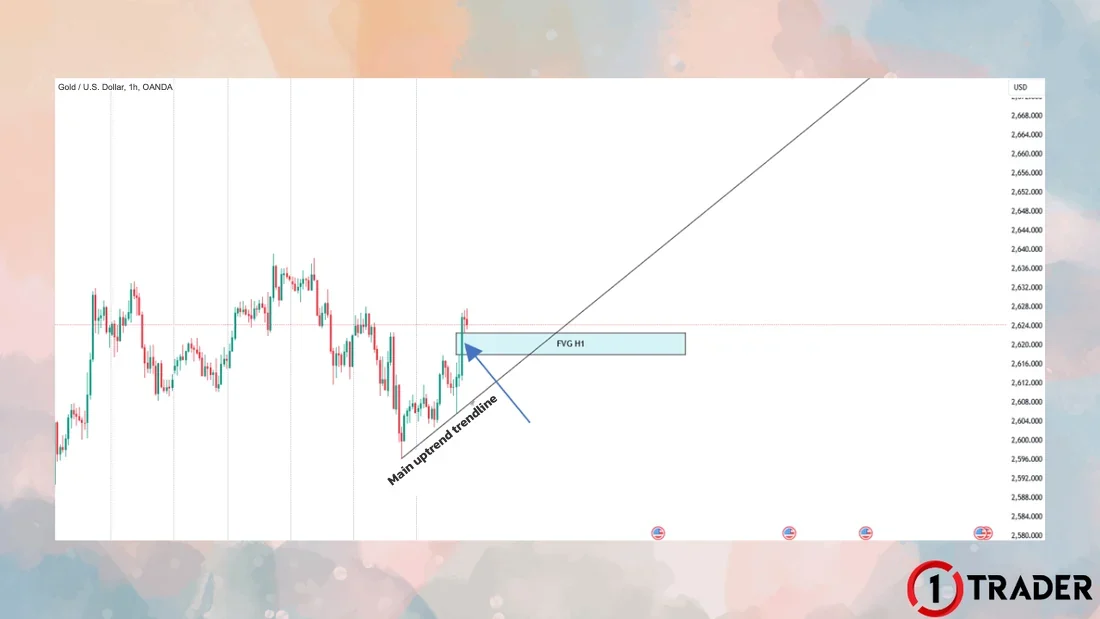
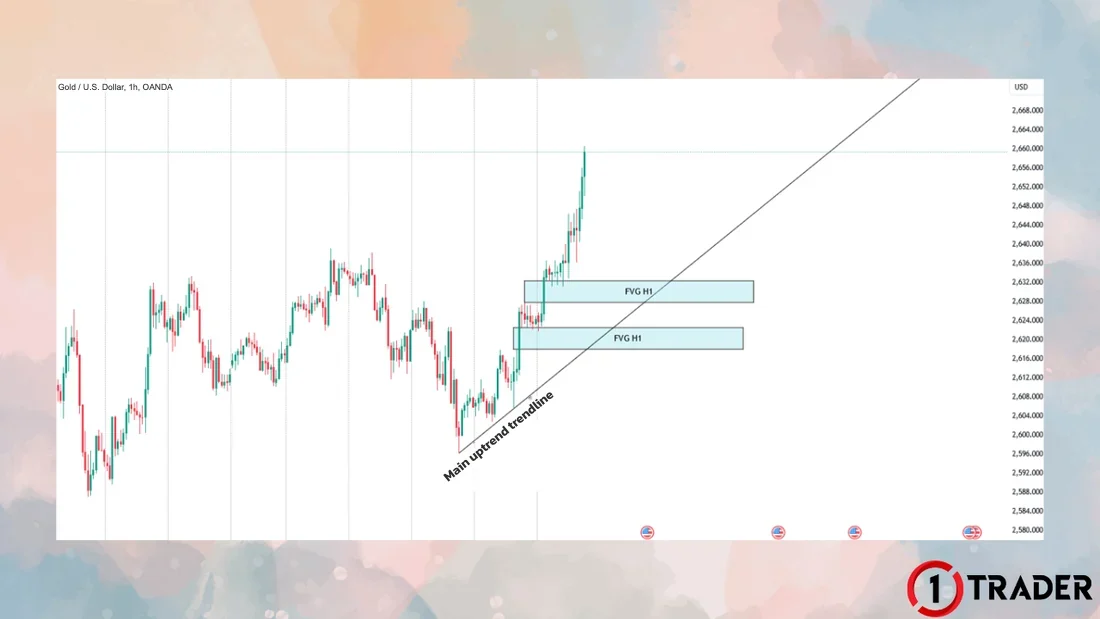
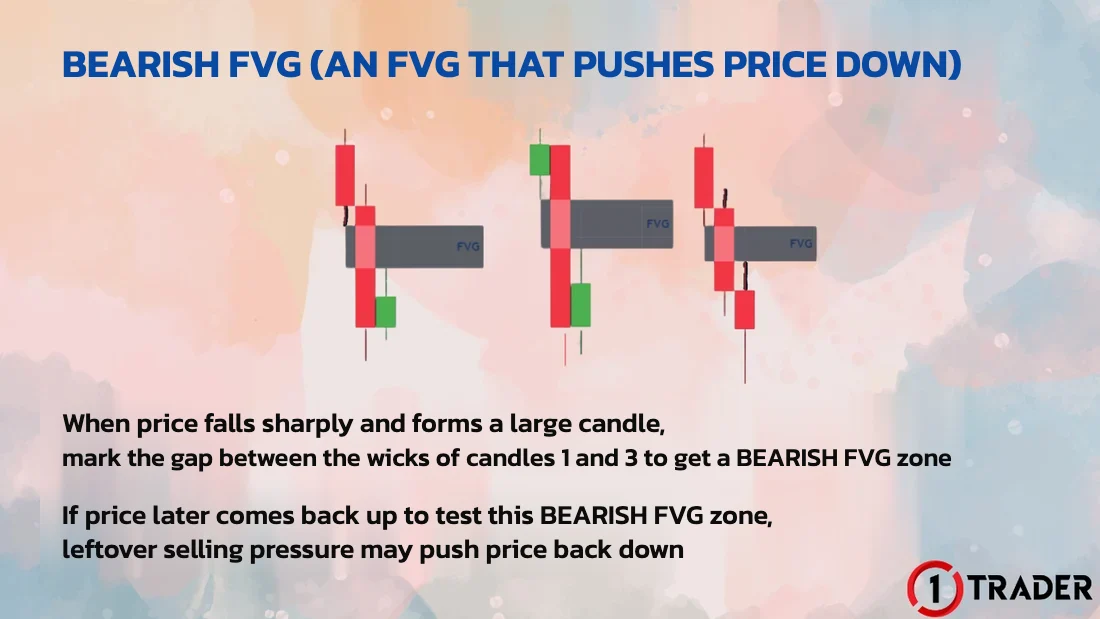
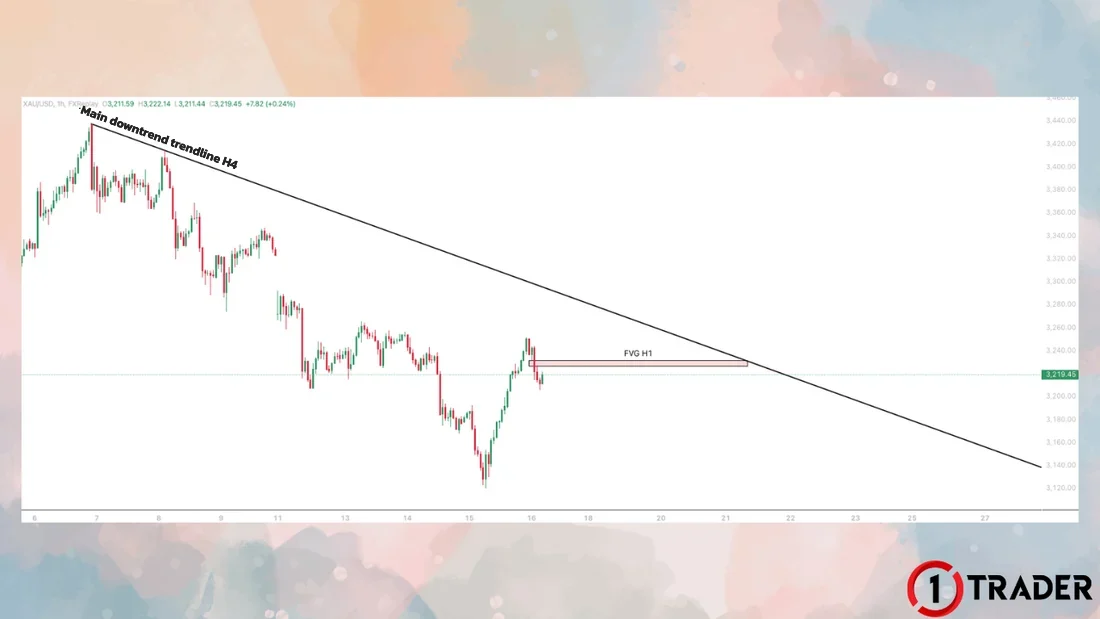
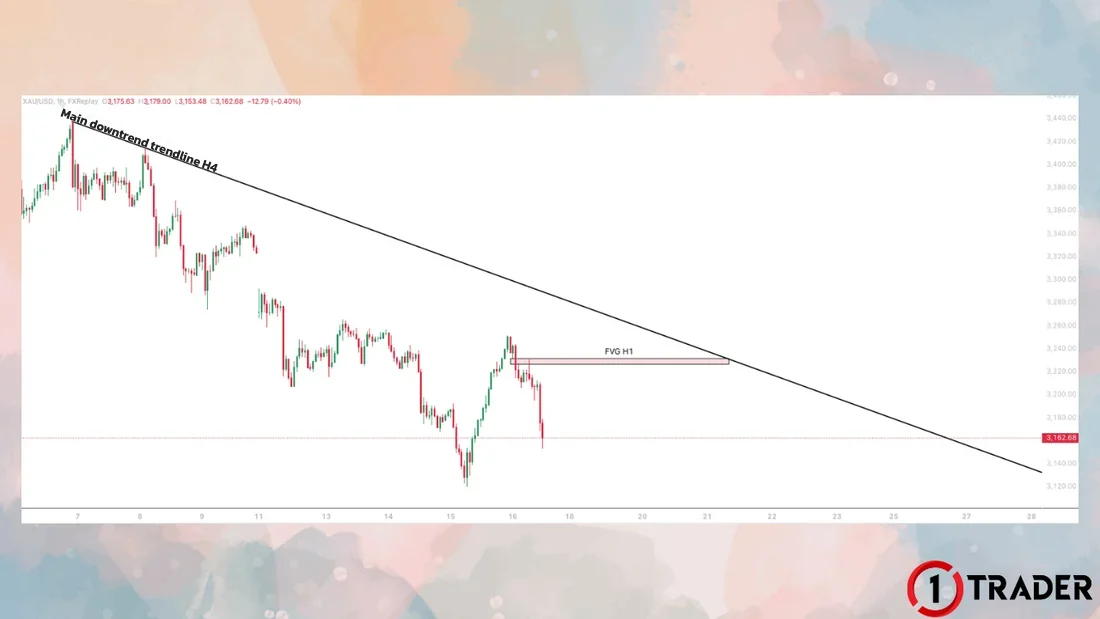
An FVG (Fair Value Gap) is a support or resistance area formed by the gap between the wicks of candle 1 and candle 3, created when candle 2 moves so fast that buying and selling become unbalanced. Markets naturally rebalance, so price often comes back to fill the gap before moving on, but not every time; sometimes it only fills part of it or just keeps running.
Many traders see an FVG as a footprint of large orders. Like demand and supply, an FVG shows a support or resistance area, not an entry point. Read how to mark the zone in detail in Fair Value Gap (EP6), or use the free FVG indicator (EP36).
1. Bullish FVG an FVG that pushes price up
2. Bearish FVG an FVG that pushes price down
Summary table: 6 support and resistance zones
| Zone | Formed by | Used for | Watch out |
|---|---|---|---|
| Demand RBR | Up → pause → up | Waiting to buy with an uptrend | A zone tested many times gets weaker |
| Demand DBR | Down → pause → up | Watching for a bullish reversal | Against the old trend; wait for the structure to change |
| Supply DBD | Down → pause → down | Waiting to sell with a downtrend | A zone tested many times gets weaker |
| Supply RBD | Up → pause → down | Watching for a bearish reversal | Against the old trend; wait for the structure to change |
| Bullish FVG | Wick gap of candles 1–3, bullish | Where to wait for a pullback in an uptrend | Not always filled |
| Bearish FVG | Wick gap of candles 1–3, bearish | Where to wait for a bounce in a downtrend | Not always filled |
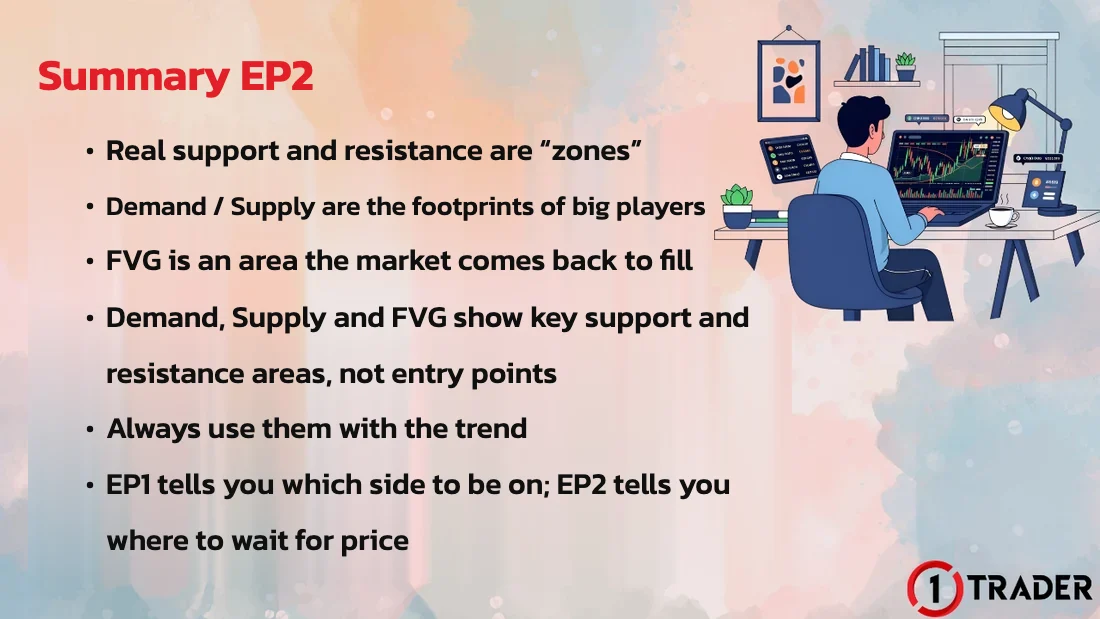
EP38 tells you which side to be on; EP39 tells you where to wait for price
The final part of this series covers building momentum and finding entries once price reaches a zone. Meanwhile, practise marking zones on past charts with Bar Replay (EP34), or check your work with the free zone indicator (EP16). Review the basics of zones in Demand & Supply Zone (EP5).
Frequently asked questions about support and resistance zones
What are support and resistance zones, and how are they different from lines?
Support and resistance zones treat these levels as a price range, not a single price, because the market needs room to match buy and sell orders, so price often pokes slightly through a line before reversing. Thinking in zones helps you place your stop loss correctly outside the area and get stopped out by wicks less often.
What are demand and supply zones?
A demand zone is a support area that forms before a strong rise, showing heavy buying there. A supply zone is a resistance area that forms before a strong drop, showing heavy selling. When price returns to the zone, the same buying or selling may appear again.
What do RBR, DBR, DBD and RBD mean?
They name zone patterns by the direction before and after the base. Demand has 2 types, Rally Base Rally (RBR) and Drop Base Rally (DBR), and supply has 2 types, Drop Base Drop (DBD) and Rally Base Drop (RBD). RBR and DBD are continuation zones, while DBR and RBD are reversal zones.
How do you mark demand and supply zones?
Find the short base of candles before the strong move, then draw a box from the base’s outer wick tip to the body edge on the other side. For demand, draw from the lowest wick to the top of the bodies; for supply, from the highest wick to the bottom of the bodies. Zones that price hasn’t come back to test yet usually carry more weight.
What is an FVG, and does price always come back to fill it?
An FVG (Fair Value Gap) is the gap between the wicks of candle 1 and candle 3, formed when candle 2 moves so strongly that buying and selling become unbalanced. Price often comes back to fill the gap, but not every time; sometimes it fills only part of it and moves on, or keeps going without coming back at all.
Can I buy or sell as soon as price touches a zone?
You shouldn’t. Demand, supply and FVG only show significant support and resistance areas, not entry points. Wait for a confirmation signal on a lower timeframe, such as a reversal candlestick pattern or divergence, and trade only zones that line up with the trend.
How do I use demand/supply and FVG together?
Check the trend first: in an uptrend use demand zones and bullish FVGs, in a downtrend use supply zones and bearish FVGs. If the two overlap or sit next to each other, that area usually carries more weight, and you place the SL outside the wider zone.
Read EP38 again Next · Free trading course See all lessons in the course Six stages, from chart basics to trade planning. More English lessons are coming soon.
View the course →
See all lessons in the free Forex and gold trading course
Risk warning: Trading leveraged Forex, gold and CFDs carries a high level of risk and you may lose all the money you invest. Support and resistance zones are a tool for weighing probabilities and do not guarantee that price will bounce. The figures in this article are examples for education. 1TRADER is a partner (IB) of some brokers and provides information to support your own decisions only. Read the full risk disclosure.